Enterprise Call Analytics
A comprehensive PBX call analytics tool that provides real-time insights into your phone system's performance, call quality, and team productivity.
Installation
Setup Instructions
- Version 70.3 and later
- Version 70.2 and earlier
Use the built-in Enterprise Call Analytics guided template — the improved, maintained version of this dashboard, so no file download is needed.
- Tenant-wide: open Settings → Custom Home Screen. Single extension: open the extension and select the User Portal tab.
- Under Start from a template, pick Enterprise Call Analytics, set the options and Save — the code is generated and the custom home screen is enabled for you.
- To customize the result, edit the generated code in the JavaScript editor on the same page.
See Custom User Portal Home Screen for details.
Older builds do not include the guided template, so install the downloadable file by hand:
- Download the dashboard file: Enterprise Call Analytics
- Upload the file as
js/user_portal_custom.jsvia Advanced → Templates → User Portal. - Modify
usr_portal.htm— load the custom script as a module:<!-- Replace this line -->
<script src="js/user_portal_custom.js?v=[[#version]]" async></script>
<!-- With this line -->
<script type="module" src="js/user_portal_custom.js?v=[[#version]]" async></script> - Remove the default component:
<!-- Remove this line -->
<script type="module" src="components/organisms/pbx-home.js?v=[[version]]"></script>
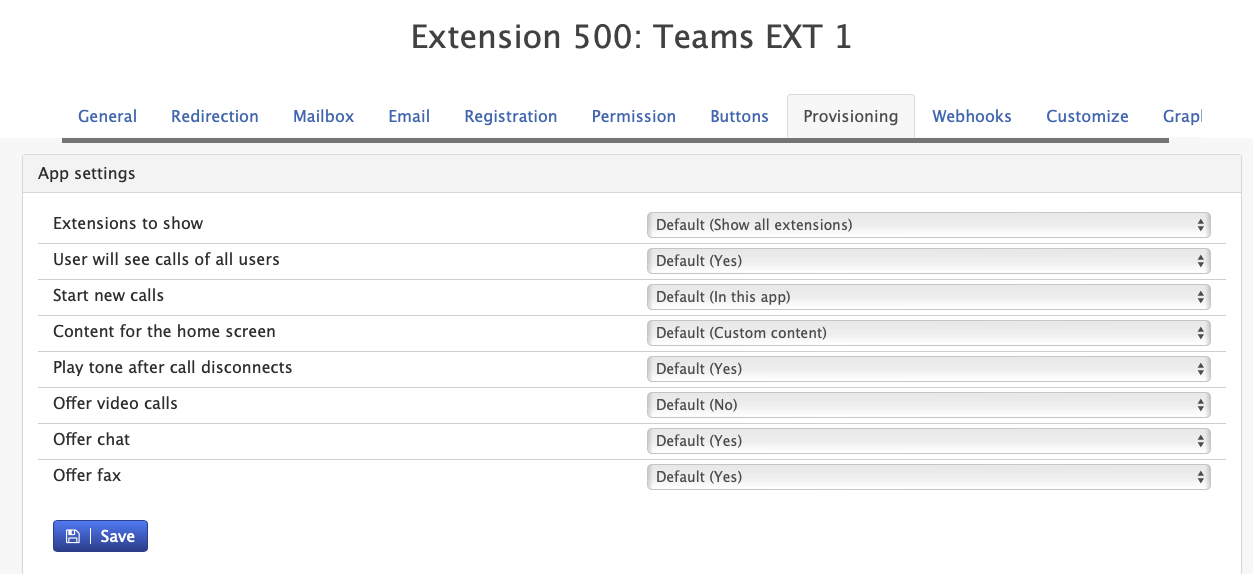
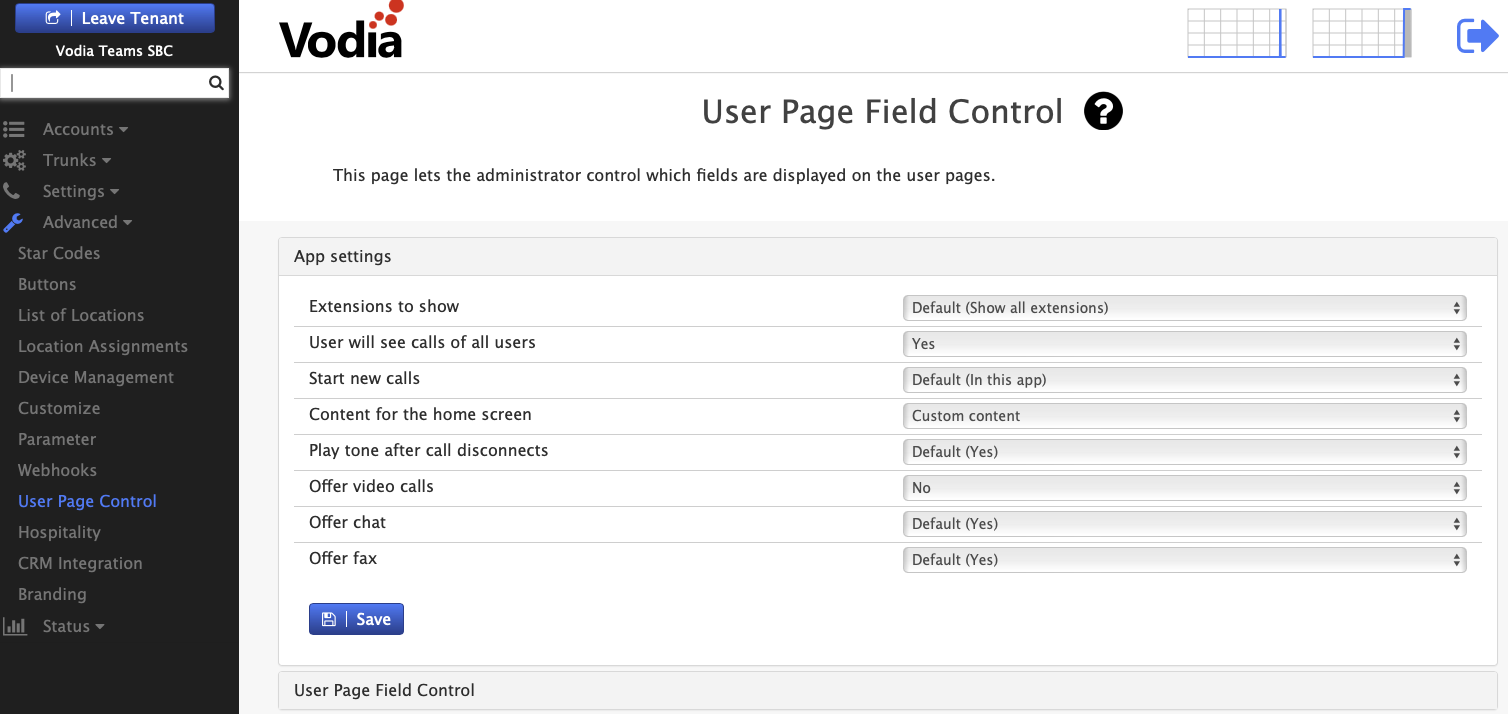
- Enable the custom home screen
- On the same page, turn on Use custom home screen and Save. Choosing a guided template sets this for you automatically.
- A tenant-wide setting applies to all extensions; a per-extension setting overrides the tenant-wide one for that user.
- Version 69
- Version 70

- Version 69
- Version 70

- Configure Required Permissions
-
Ensure Call records and Queue permissions is enabled under Tenant settings -> group
-
Key Features
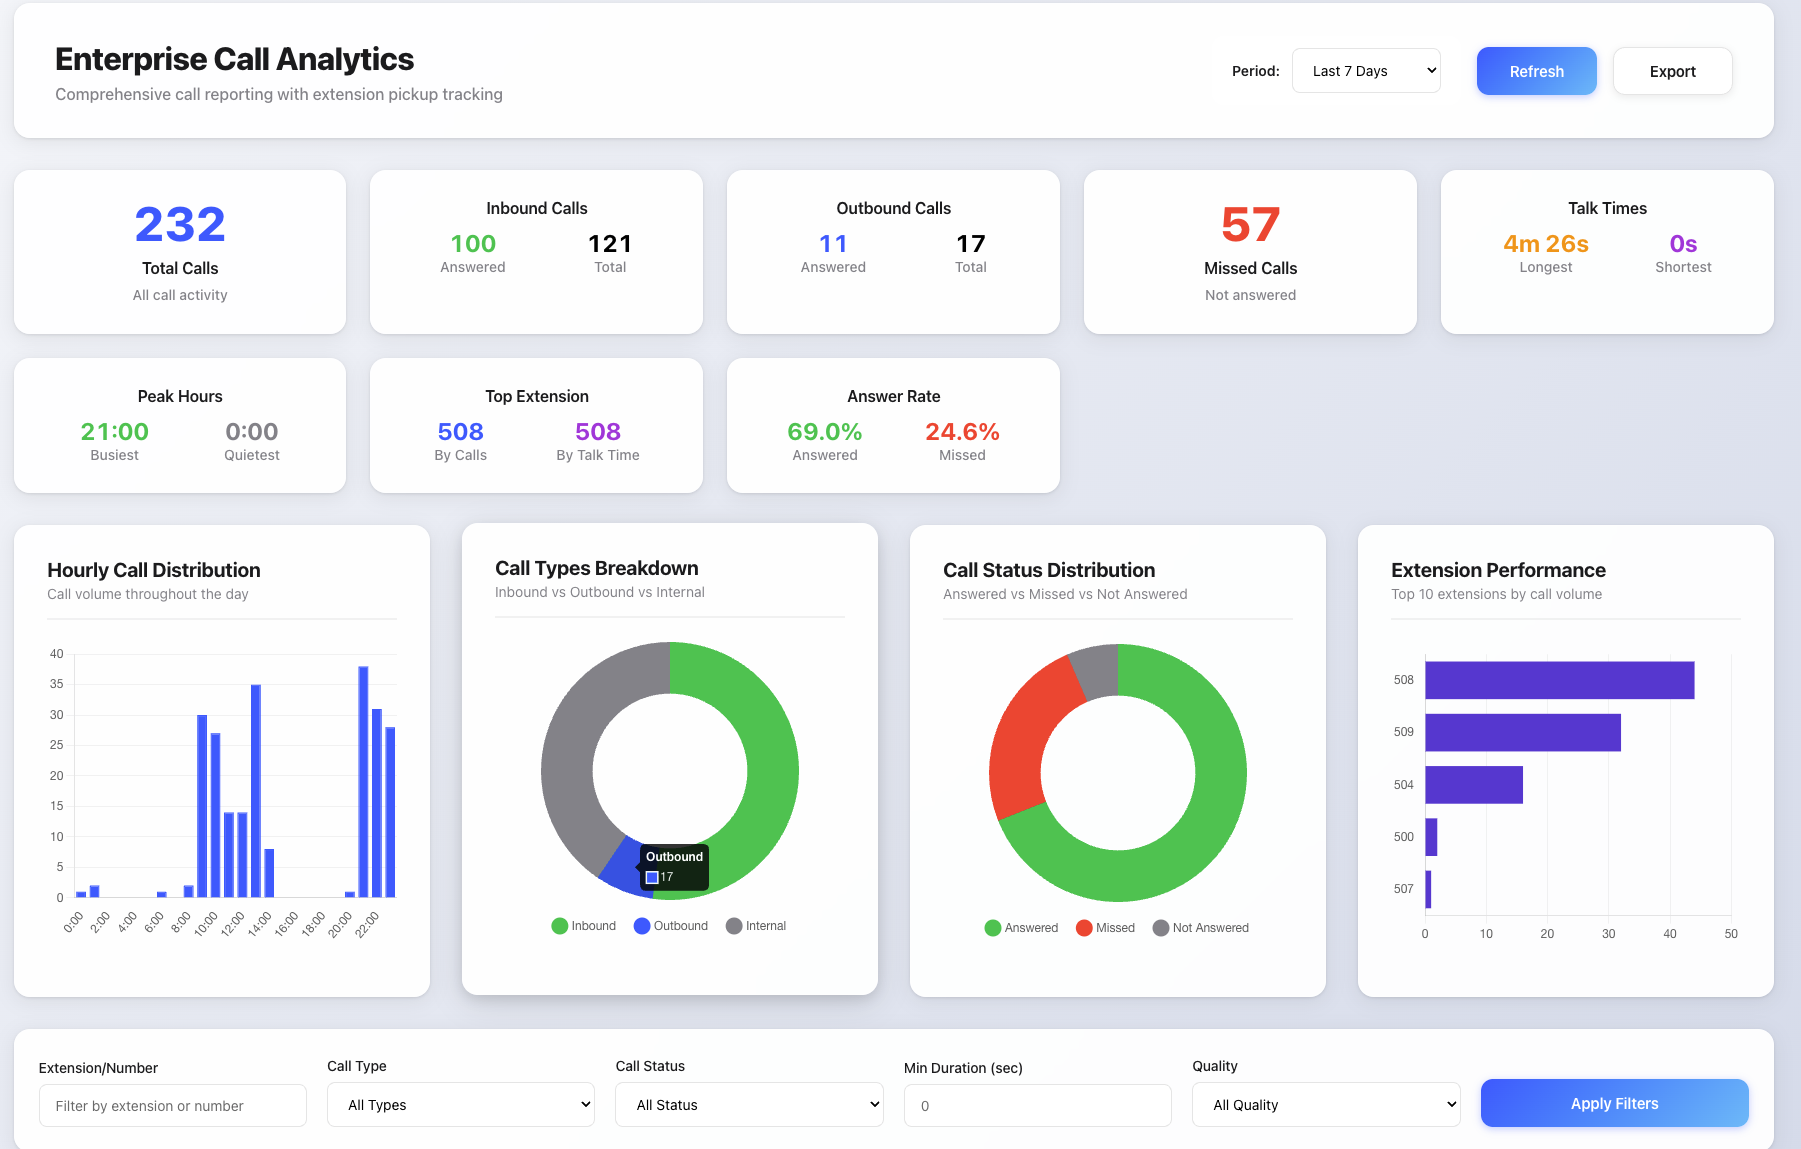
📊 Real-Time Dashboard
See your call center's performance at a glance with live metrics and visual charts that update automatically.
🎯 Key Insights
- Call Volume: Total calls, inbound vs outbound breakdown
- Answer Rates: How many calls your team is successfully handling
- Talk Times: Longest and shortest conversations
- Peak Hours: When your phone system is busiest
- Top Performers: Which extensions handle the most calls
📞 Call Quality Analysis
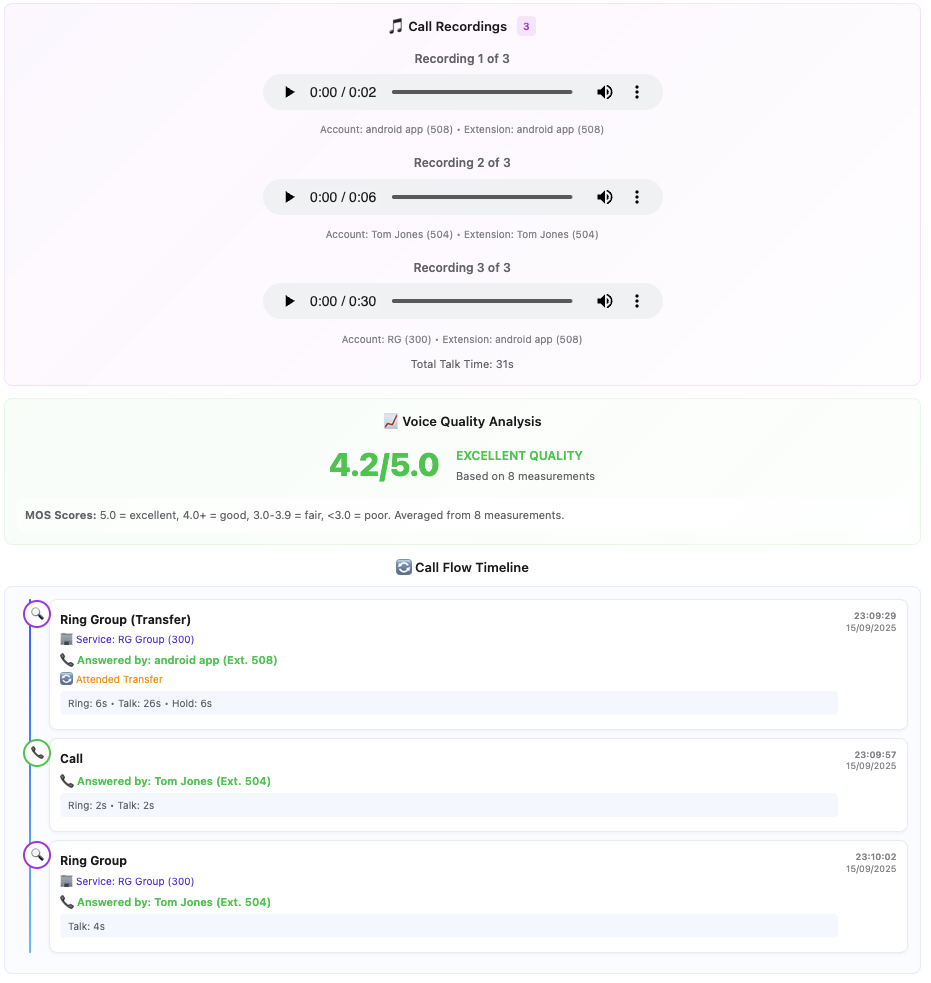
- Voice Quality Scores: Automatic analysis of call clarity (MOS scores)
- Call Routing: See how calls flow through your system (queues, ring groups, voicemail)
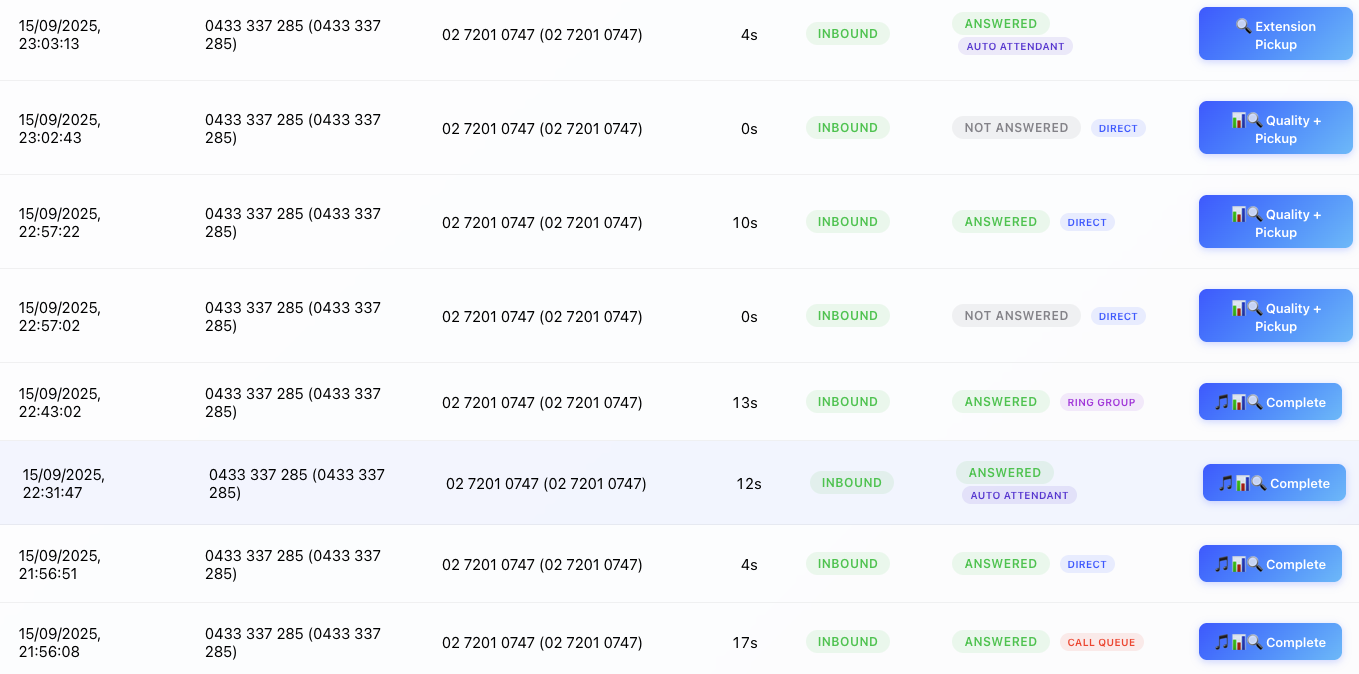
- Extension Pickup: Track which extensions answer calls and how quickly
🔍 Detailed Call Records
- Complete Call History: Every call with timestamps, duration, and participants
- Call Recordings: Listen to recordings directly in the dashboard
- Call Flow: Visual timeline showing how each call progressed through your system
- Transfer Tracking: Identify attended and blind transfers
How to Use the Dashboard
Quick Start
- Select Time Period: Choose from preset ranges (Today, Last Week, etc.) or set custom dates
- View Metrics: Check the summary cards for key performance indicators
- Analyze Charts: Review visual breakdowns of call patterns
- Filter Calls: Use search filters to find specific calls or patterns
- Export Data: Download reports for further analysis
Understanding the Metrics
Answer Rate: Percentage of calls successfully answered by your team
- 🟢 Good: 80%+
- 🟡 Monitor: 60-80%
- 🔴 Needs Attention: Below 60%
Call Quality Score: Voice clarity rating (1-5 scale)
- 🟢 Excellent: 4.0+
- 🟡 Good: 3.0-3.9
- 🔴 Poor: Below 3.0
Peak Hours: Shows when your phone system is most active - useful for staffing decisions
Advanced Features
Call Detail Analysis
Click "View Details" on any call to see:
- Call Timeline: Step-by-step flow through your phone system
- Quality Analysis: Voice quality measurements if available
- Recordings: Listen to call recordings
- Extension Details: See which staff member handled the call
Smart Filtering
Find specific calls using filters:
- Extension/Number: Search by phone number or extension
- Call Type: Inbound, outbound, or internal calls
- Call Status: Answered, missed, or not answered
- Duration: Filter by talk time length
- Quality: Filter by call quality ratings
Export Options
Download your data in CSV format:
- Call Analytics: Summary statistics and performance metrics
- Detailed Call Records: Complete call history with all details
- Custom Date Ranges: Export specific time periods
What the Charts Show
Hourly Distribution
Bar chart showing call volume throughout the day - helps identify busy periods for staffing
Call Types
Pie chart breaking down inbound vs outbound vs internal calls
Call Status
Shows how many calls were answered, missed, or went unanswered
Extension Performance
Bar chart of your top-performing extensions by call volume
Tips for Better Results
Daily Monitoring
- Check answer rates each morning
- Review missed calls from the previous day
- Monitor peak hour patterns for staffing
Weekly Analysis
- Compare performance week-over-week
- Identify trends in call quality
- Review top-performing team members
Quality Improvements
- Focus on calls with poor quality scores
- Use call recordings for training opportunities
- Monitor transfer patterns to optimize call routing
Data Export for Reports
- Export weekly summaries for management reports
- Use detailed call logs for compliance requirements
- Download quality data for performance reviews
Troubleshooting
No Data Showing?
- Check your date range settings
- Ensure you have permission to view call records
- Try refreshing the dashboard
Charts Not Loading?
- Refresh your browser
- Check if you have calls in the selected time period
- Try a different time range
Can't Hear Recordings?
- Check your browser's audio permissions
- Ensure your speakers/headphones are working
- Some recordings may not be available due to system settings
Performance Note: The dashboard works best when viewing periods of 30 days or less. Larger date ranges may take longer to load.