Vodia Agent Activity Dashboard (Live Agent Status and Login Activity)
Overview
The Vodia Agent Activity Monitor Dashboard provides comprehensive real-time monitoring of agent status and queue performance across your call center operations. This dashboard gives supervisors and administrators instant visibility into agent availability, call activity, queue metrics, and historical performance data.
Key Features
Real-Time Agent Monitoring
- Live agent status: See which agents are online, on calls, in DND mode, or offline
- Queue membership tracking: Visual display of which queues each agent is assigned to
- Instant status updates: Automatic refresh of agent status changes without page reload
Smart Queue Badge System
- Active queue indicators: Blue badges show queues where agents are logged in and available
- Inactive queue indicators: Gray badges show queue assignments where agents are logged out
- Real-time login tracking: Badges update immediately when agents log in/out of queues
- Complete queue visibility: Full queue names and numbers displayed without truncation
Historical Performance Analytics
- Configurable time periods: View data for today, yesterday, this week, or last week
- Call statistics: Track conbined answered calls, abandoned calls, and wait times across all Queues
- Alert indicators: Visual warnings when abandonment rates or wait times exceed normal levels
- Agent Login Activity: Each agent now shows a separate timeline bar for every queue they're a member of and each timeline shows login/logout activity specifically for that queue
Live Queue Performance
- Current queue length: See how many callers are waiting in each queue
- Wait time monitoring: Track current and maximum wait times
- Active call counts: Monitor how many agents are currently handling calls
- Summary metrics: Dashboard cards showing key performance indicators
Installation
Setup Instructions
- Download the dashboard file
- Here is the link to download the JS file: Agent Activity Dashboard
PBX version
The file-installation step differs by version. Use the Version 70.3 and later tab for the simplified flow; on Version 70.2 and earlier follow the legacy tab.
- Version 70.3 and later
- Version 70.2 and earlier
- Upload it as the custom home module
- At Tenant level, go to Advanced → Templates, select the User Portal template type, and select
js/user_portal_custom.jsas the page. - Paste the downloaded file's contents and save.
- At Tenant level, go to Advanced → Templates, select the User Portal template type, and select
- Upload the file as
js/user_portal_custom.jsvia Advanced → Templates → User Portal. - Modify
usr_portal.htm— load the custom script as a module:<!-- Replace this line -->
<script src="js/user_portal_custom.js?v=[[#version]]" async></script>
<!-- With this line -->
<script type="module" src="js/user_portal_custom.js?v=[[#version]]" async></script> - Remove the default component:
<!-- Remove this line -->
<script type="module" src="components/organisms/pbx-home.js?v=[[version]]"></script>
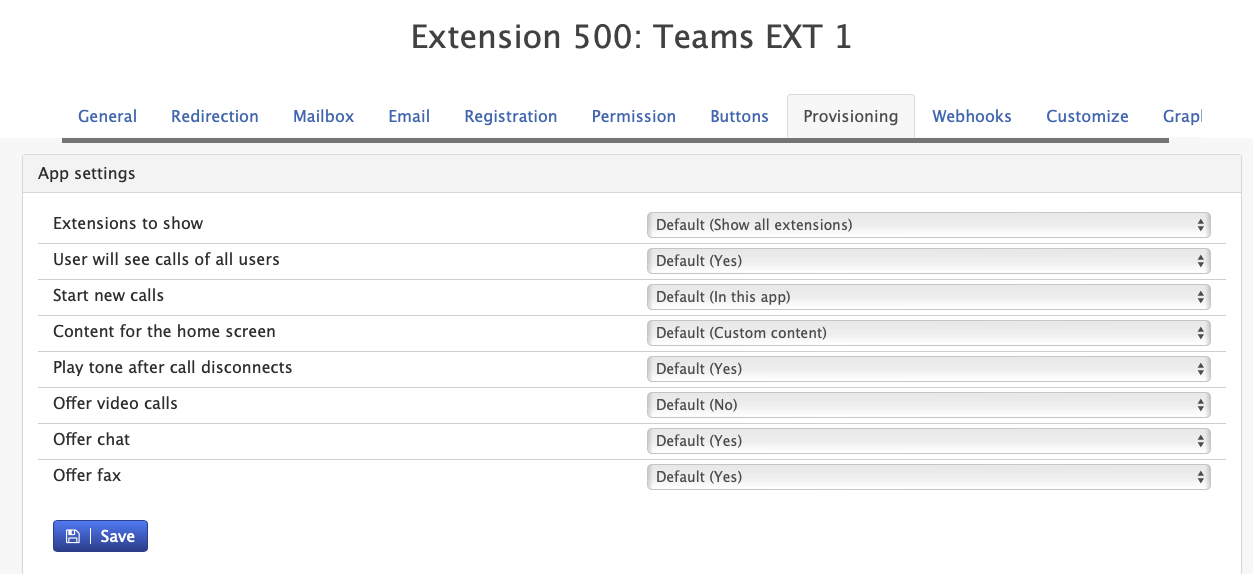
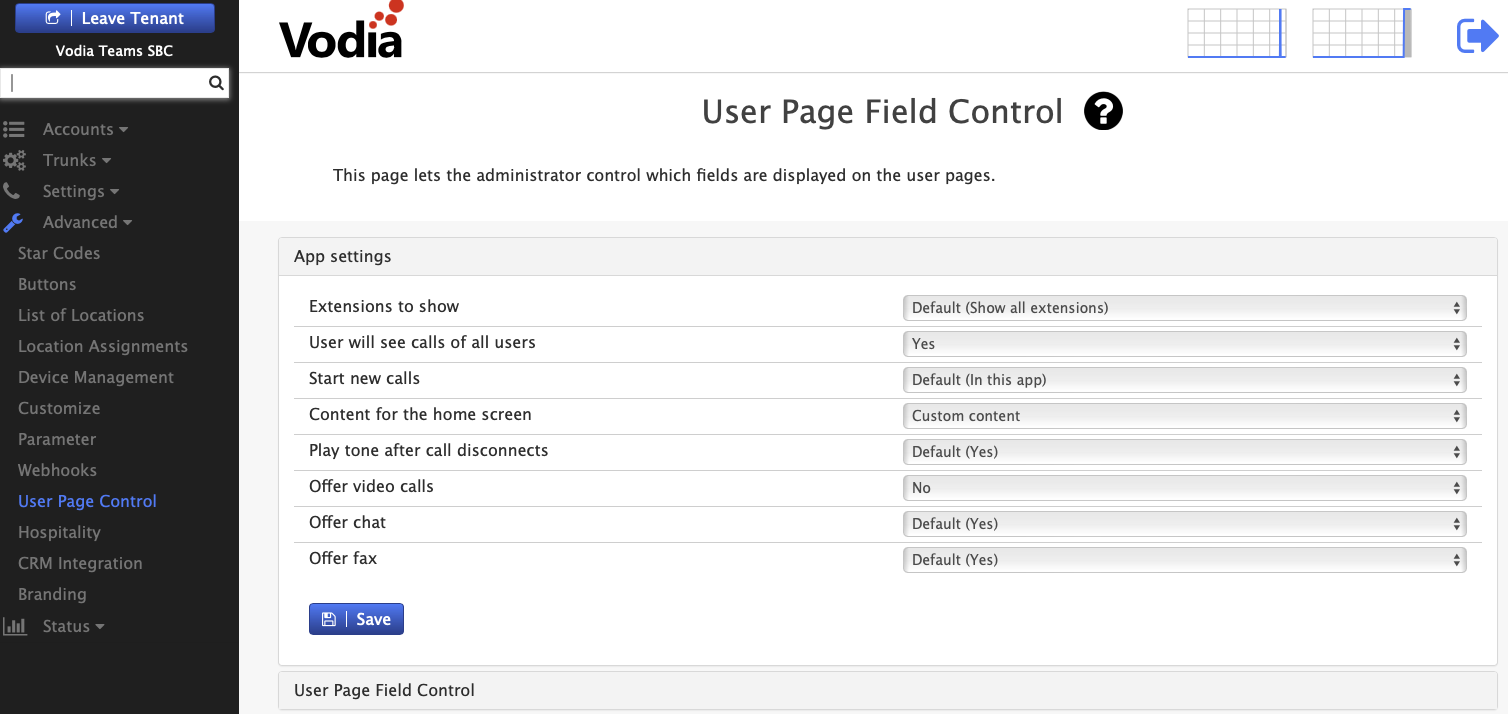
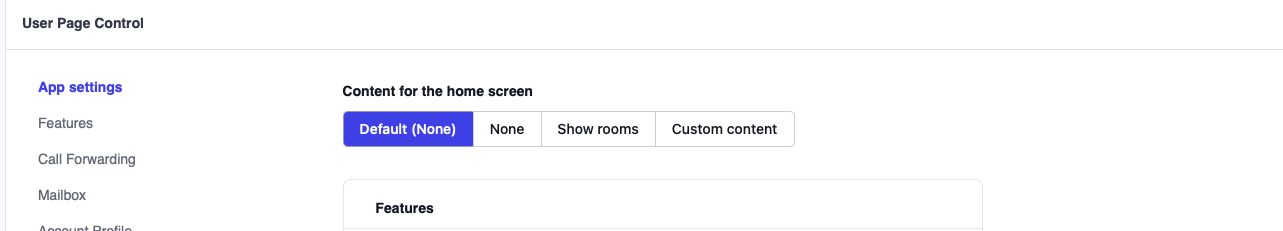
- Enable Custom Homescreen
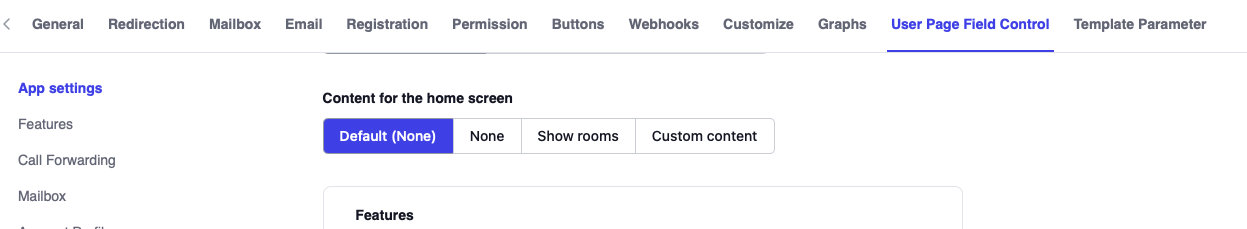
- Set Content for the home screen to Custom Content. This can be applied tenant-wide (all extensions) or to a specific extension — extensions inherit the tenant-wide setting unless individually overridden.
- Tenant-wide: Tenant → Advanced → User Page Control
- Single extension: open the extension → User Page Field Control tab
- Version 69
- Version 70
- Version 69
- Version 70
- Configure Required Permissions
-
Ensure Call records and Queue permissions is enabled under Tenant settings -> group
-
Configuration
Dashboard Settings
- Auto-refresh interval: Default 30 seconds for data updates
- Queue display limit: Shows up to 10 queues by default
- Historical data range: Configurable from today to last week
Usage Guide
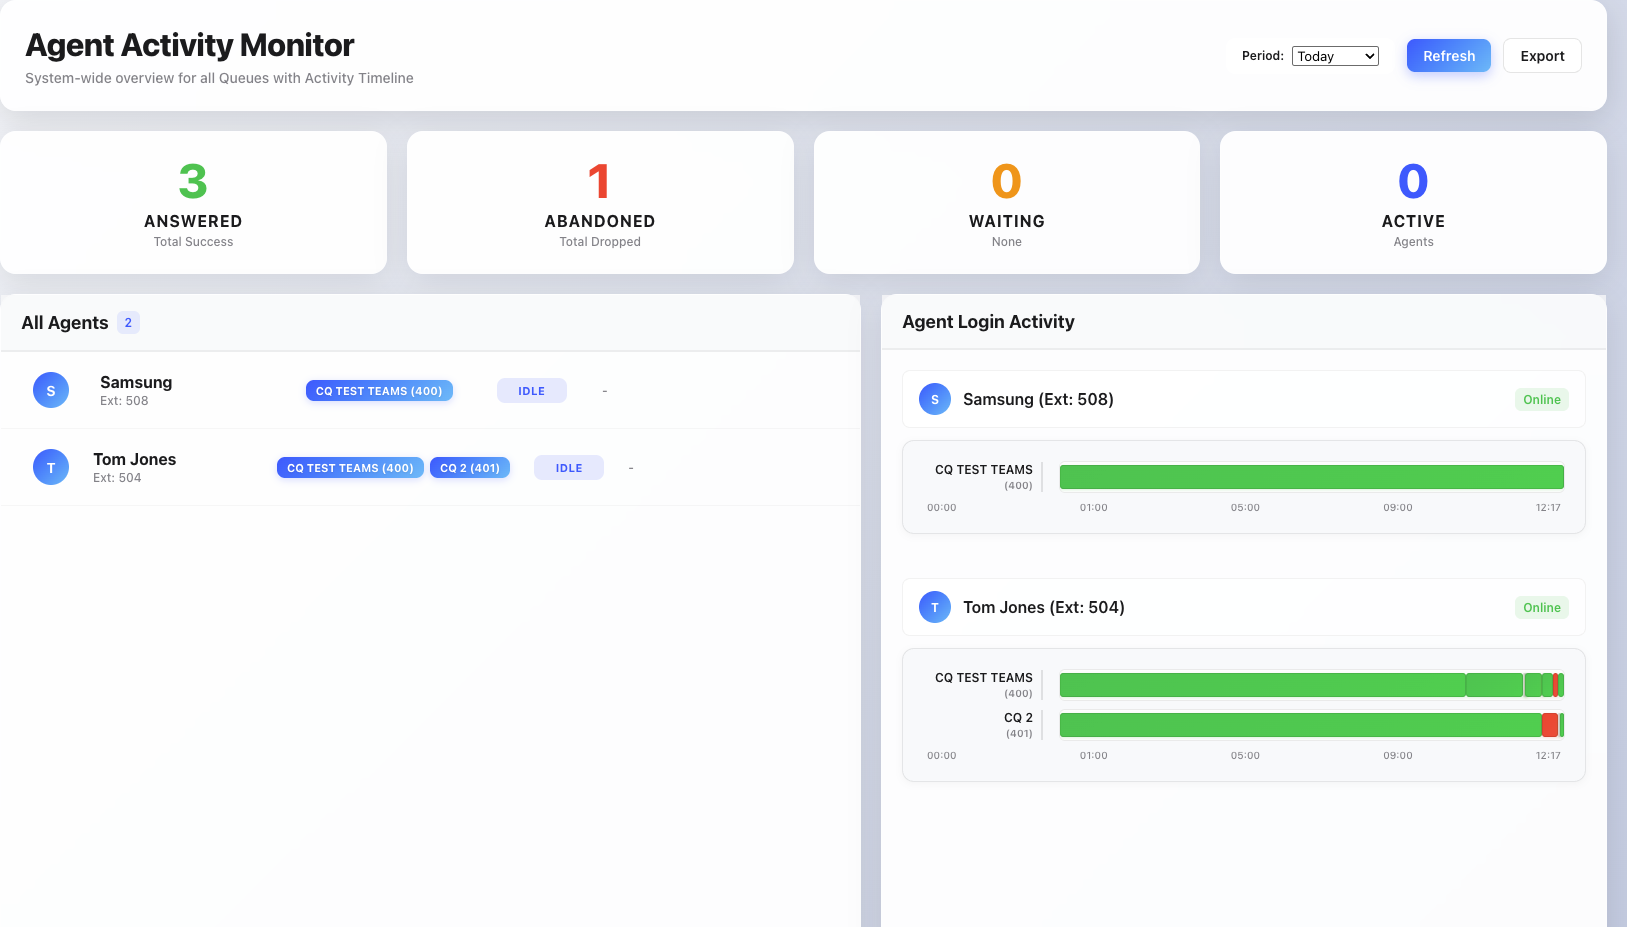
Dashboard Overview
When you open the dashboard, you'll see:
- Summary cards at the top showing total answered, abandoned, waiting, and active counts
- Agent list below showing all agents with their current status and queue assignments
- Control panel in the header for time period selection and data export
Understanding Agent Status
- Green highlight: Agent is currently on an active call or ringing
- Red highlight: Agent is in Do Not Disturb mode
- No highlight: Agent is idle and available for calls
Queue Badge Colors
- Blue badges: Agent is logged into this queue and can receive calls
- Gray badges: Agent is assigned to this queue but currently logged out