Vodia Queue Overview Analytics Dashboard
Overview
The Vodia Queue Overview Analytics Dashboard provides comprehensive real-time queue performance monitoring and historical analysis. This dashboard delivers actionable insights into queue operations, agent performance, call distribution patterns, and abandonment trends across your call center infrastructure.
Key Features
📊 Real-Time Queue Monitoring
- Queue metrics: Current queue length, wait times, and active call volumes
- Multi-queue support: Monitor all queues or focus on specific queue performance
- Agent status tracking: Real-time visibility into agent login status, DND states, and availability
- Live performance indicators: Instant updates on key performance metrics
📈 Historical Analytics Engine
- Configurable time periods: Today, yesterday, week, month analysis options
- Call volume trends: Hourly distribution patterns and peak period identification
- Performance tracking: Talk time, IVR time, ring time, and wait time analysis
- Abandonment analysis: Daily abandon rate trends and pattern identification
👥 Agent Performance Analytics
- Individual agent breakdowns: Calls handled, talk time, and status monitoring
- Performance ranking: Identification of most active agents by calls and talk time
- Status visualization: Online, DND, and offline agent categorization
- Historical agent stats: Cumulative performance data across selected periods
📋 Interactive Data Visualization
- Call volume charts: Bar charts showing hourly call distribution patterns
- Performance pie charts: Visual breakdown of talk, IVR, and ring time proportions
- Abandon rate trends: Line charts tracking abandonment patterns over time
- Dynamic chart updates: Real-time chart refreshing with new data
🔄 Auto-Refresh & Export
- Automatic data refresh: Configurable 30-second intervals for live updates
- Data export capabilities: JSON export of complete analytics dataset
- Agent data export: Dedicated export functionality for agent performance data
- Historical data preservation: Maintains performance history across refresh cycles
Installation
Setup Instructions
- Version 70.3 and later
- Version 70.2 and earlier
Use the built-in Queue Overview Analytics guided template — the improved, maintained version of this dashboard, so no file download is needed.
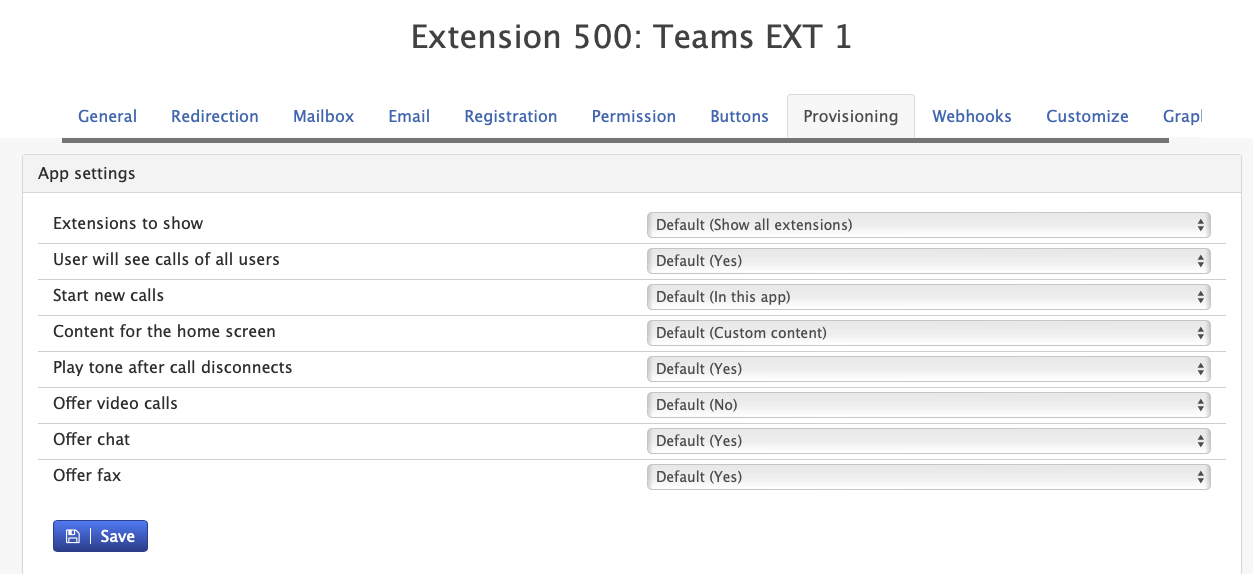
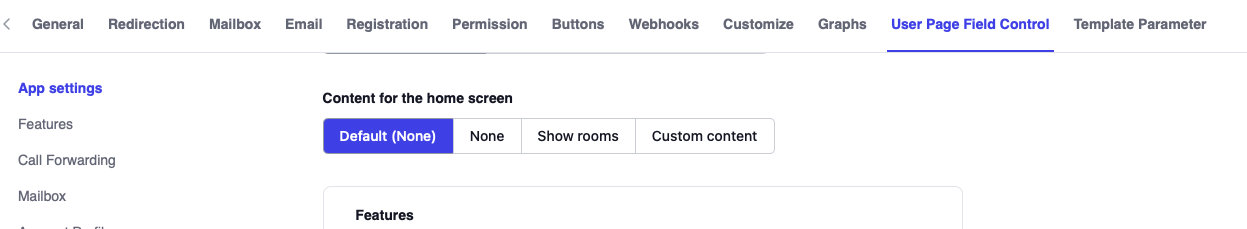
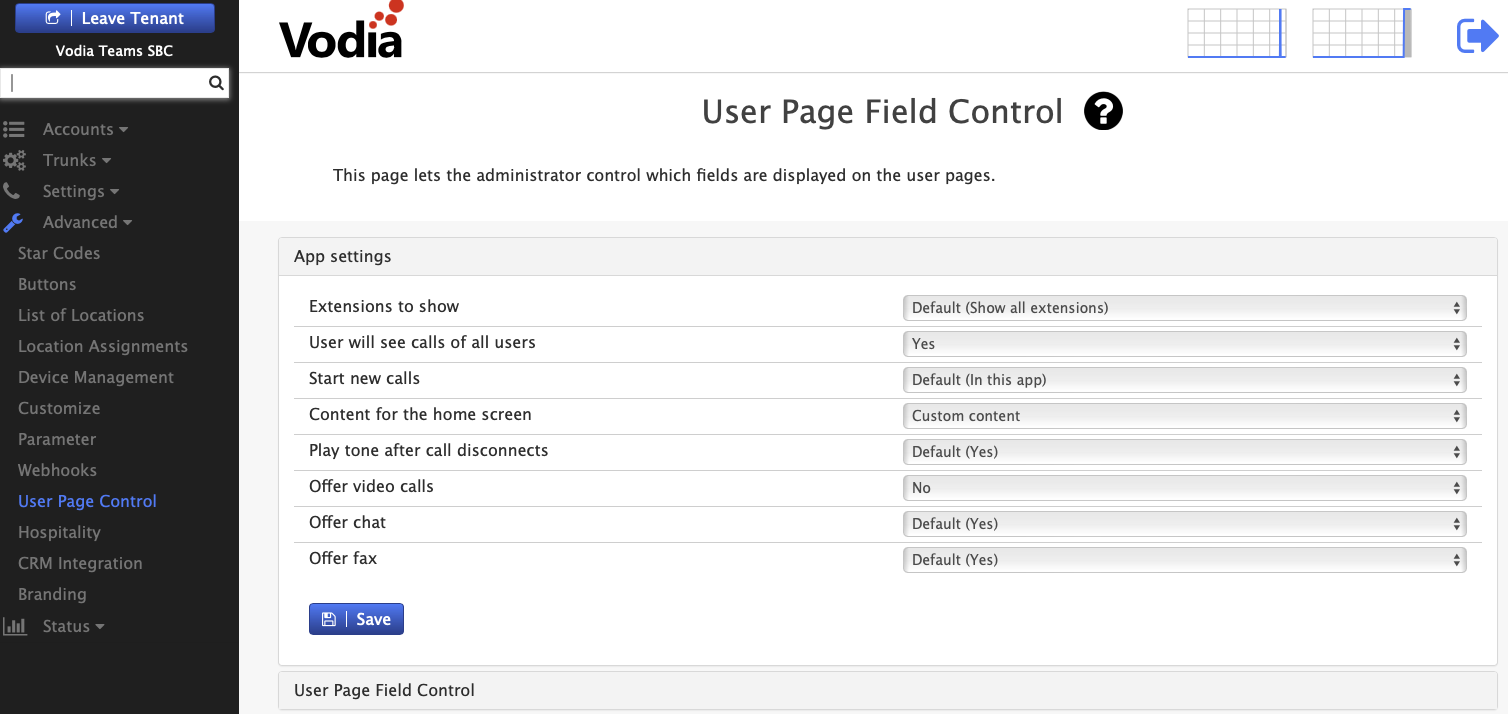
- Tenant-wide: open Settings → Custom Home Screen. Single extension: open the extension and select the User Portal tab.
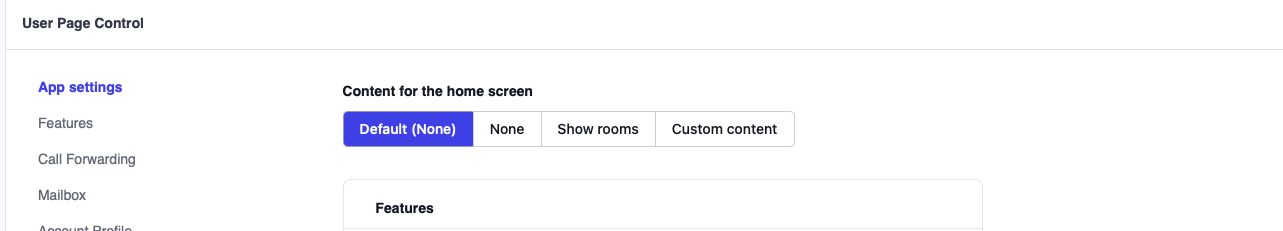
- Under Start from a template, pick Queue Overview Analytics, set the options and Save — the code is generated and the custom home screen is enabled for you.
- To customize the result, edit the generated code in the JavaScript editor on the same page.
See Custom User Portal Home Screen for details.
Older builds do not include the guided template, so install the downloadable file by hand:
- Download the dashboard file: Queue Analytics Dashboard
- Upload the file as
js/user_portal_custom.jsvia Advanced → Templates → User Portal. - Modify
usr_portal.htm— load the custom script as a module:<!-- Replace this line -->
<script src="js/user_portal_custom.js?v=[[#version]]" async></script>
<!-- With this line -->
<script type="module" src="js/user_portal_custom.js?v=[[#version]]" async></script> - Remove the default component:
<!-- Remove this line -->
<script type="module" src="components/organisms/pbx-home.js?v=[[version]]"></script>
This queue analytics dashboard makes extensive API calls to compile real-time statistics. We recommend deploying it selectively for users who require queue monitoring capabilities. Consider the server load impact when enabling for multiple concurrent users.
- Enable the custom home screen
- On the same page, turn on Use custom home screen and Save. Choosing a guided template sets this for you automatically.
- A tenant-wide setting applies to all extensions; a per-extension setting overrides the tenant-wide one for that user.
- Version 69
- Version 70
- Version 69
- Version 70
- Configure Required Permissions
- Ensure Call records and Queue permissions is enabled under Tenant settings -> group
Configuration
Refresh Interval Configuration
// Auto-refresh settings (default: 300 seconds)
this.refreshInterval = 300000;
- Configurable intervals: Adjust refresh frequency based on requirements
- Manual refresh: On-demand data refresh capability
Time Period Settings
- Default period: Today's data analysis
- Available ranges: Today, Yesterday, This Week, Last Week, This Month
- Historical depth: Up to 30 days of historical analysis
- Dynamic date ranges: Real-time period switching
Usage Guide
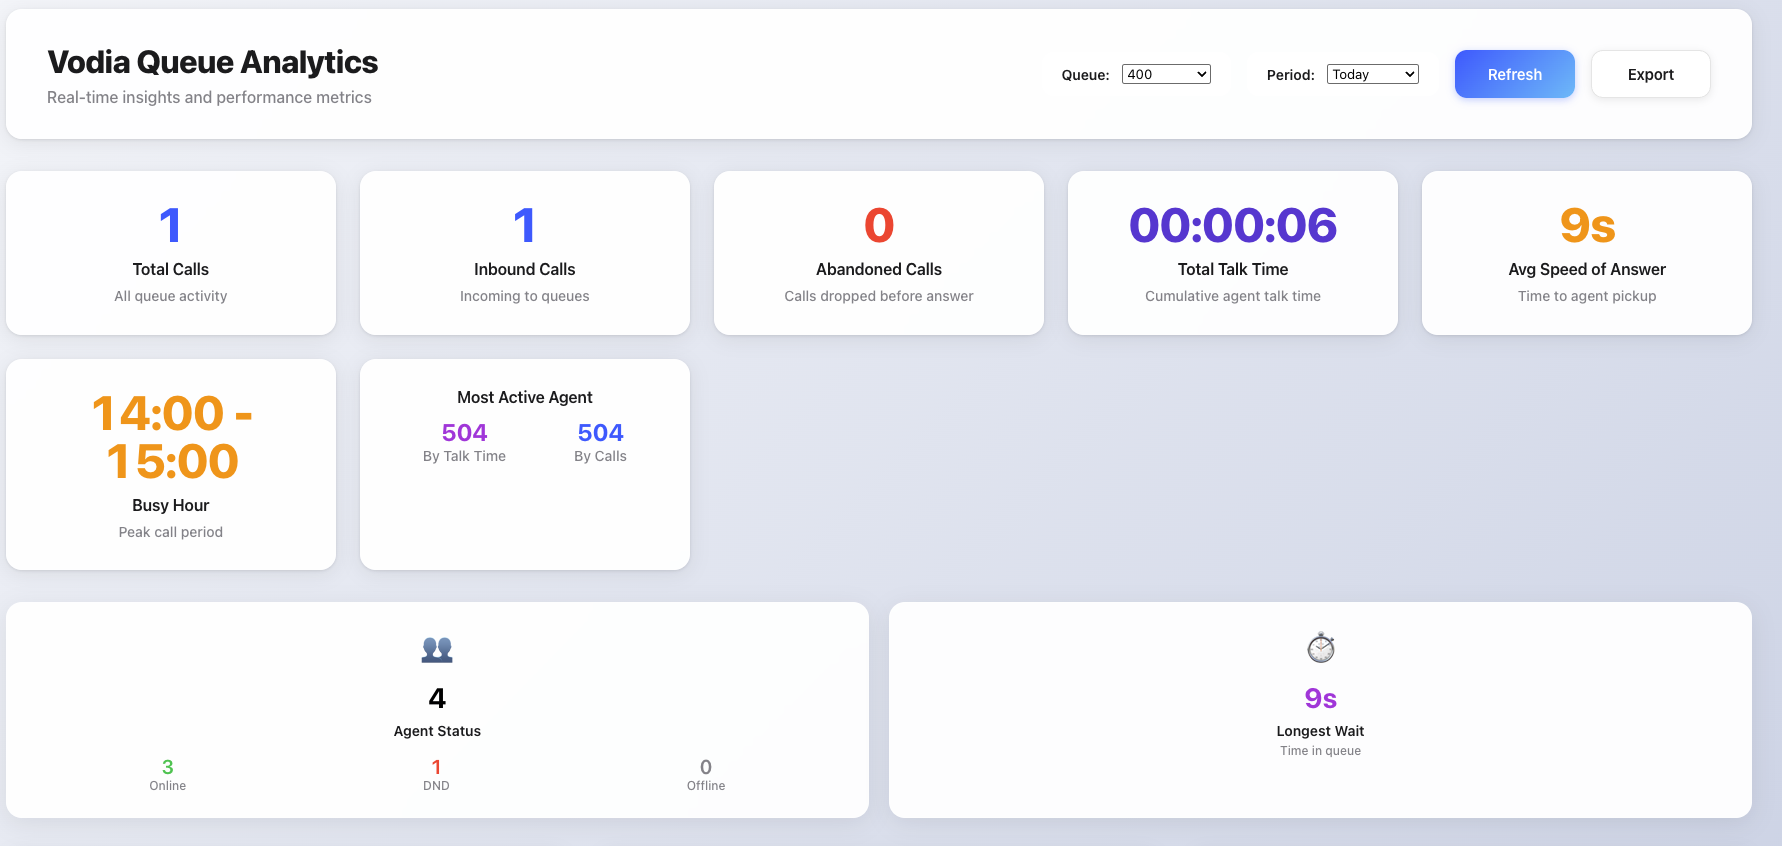
1. Dashboard Overview
- Launch the dashboard to view real-time queue performance metrics
- Use the queue selector dropdown to focus on specific queues or view all
- Monitor key performance indicators in the metric cards at the top
2. Time Period Analysis
- Select different time periods using the period dropdown
- View historical trends and patterns across different timeframes
- Compare current performance against historical baselines
3. Real-Time Monitoring
- Monitor live agent status and queue lengths
- Track current wait times and active call volumes
- Observe real-time changes in agent availability and DND status
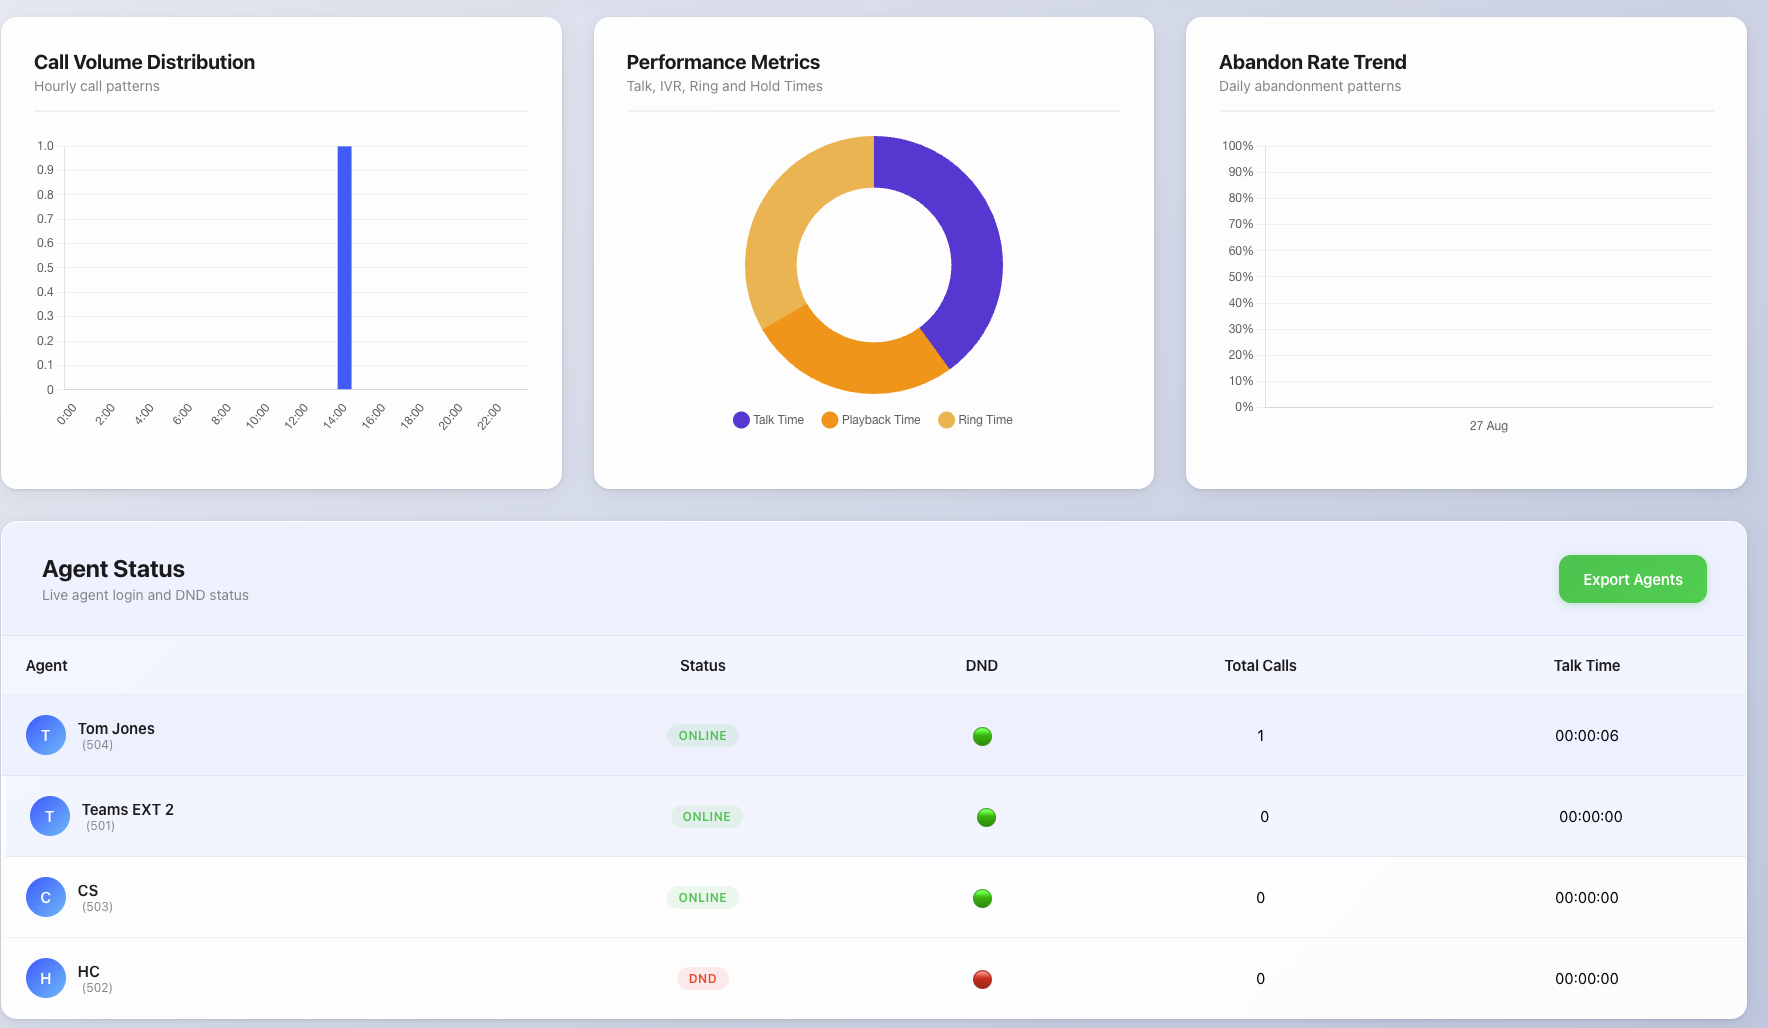
4. Performance Analysis
- Review call volume distribution charts to identify peak periods
- Analyze talk time, IVR time, and ring time proportions
- Monitor abandon rate trends to identify problem patterns
5. Agent Management
- Review individual agent performance in the agent breakdown table
- Identify top-performing agents by calls handled and talk time
- Monitor agent status and availability for workforce management
6. Data Export
- Export complete analytics dataset using the main export button
- Export agent-specific data using the dedicated agent export function
- Save historical data for external analysis and reporting
Key Metrics Explained
| Metric | Description | Usage |
|---|---|---|
| Total Calls | All calls processed by selected queues | Overall queue activity volume |
| Inbound Calls | Successfully answered queue calls | Service delivery measurement |
| Abandoned Calls | Calls dropped before agent pickup | Service quality indicator |
| Total Talk Time | Cumulative agent conversation time | Agent productivity measurement |
| Avg Speed of Answer | Average time from queue entry to pickup | Service efficiency indicator |
| Busy Hour | Peak call volume period identification | Resource planning insight |
| Most Active Agent | Top performer by talk time and call volume | Performance recognition |
| Agent Status | Current online, DND, and offline counts | Staffing availability overview |
| Longest Wait | Current maximum queue wait time | Real-time service level indicator |
Chart Types & Analysis
📊 Call Volume Distribution
- Hourly patterns: 24-hour call volume visualization
- Peak identification: Automatic busy hour calculation
- Trend analysis: Historical volume pattern recognition
- Capacity planning: Resource allocation insights
🥧 Performance Metrics Breakdown
- Time allocation: Talk, IVR, and ring time proportions
- Efficiency analysis: Agent utilization measurements
- Resource optimization: Identify areas for improvement
- Visual comparison: Easy-to-read pie chart format
📈 Abandon Rate Trends
- Daily tracking: Abandonment patterns over time
- Threshold monitoring: Identify concerning trends
- Performance indicators: Color-coded alert levels
- Historical comparison: Track improvement over periods
Technical Requirements
Browser Compatibility
- Modern browsers with ES6 module support
- WebGL support for advanced chart rendering
- Local/session storage for configuration persistence