Enhanced Analytics Dashboard
Overview
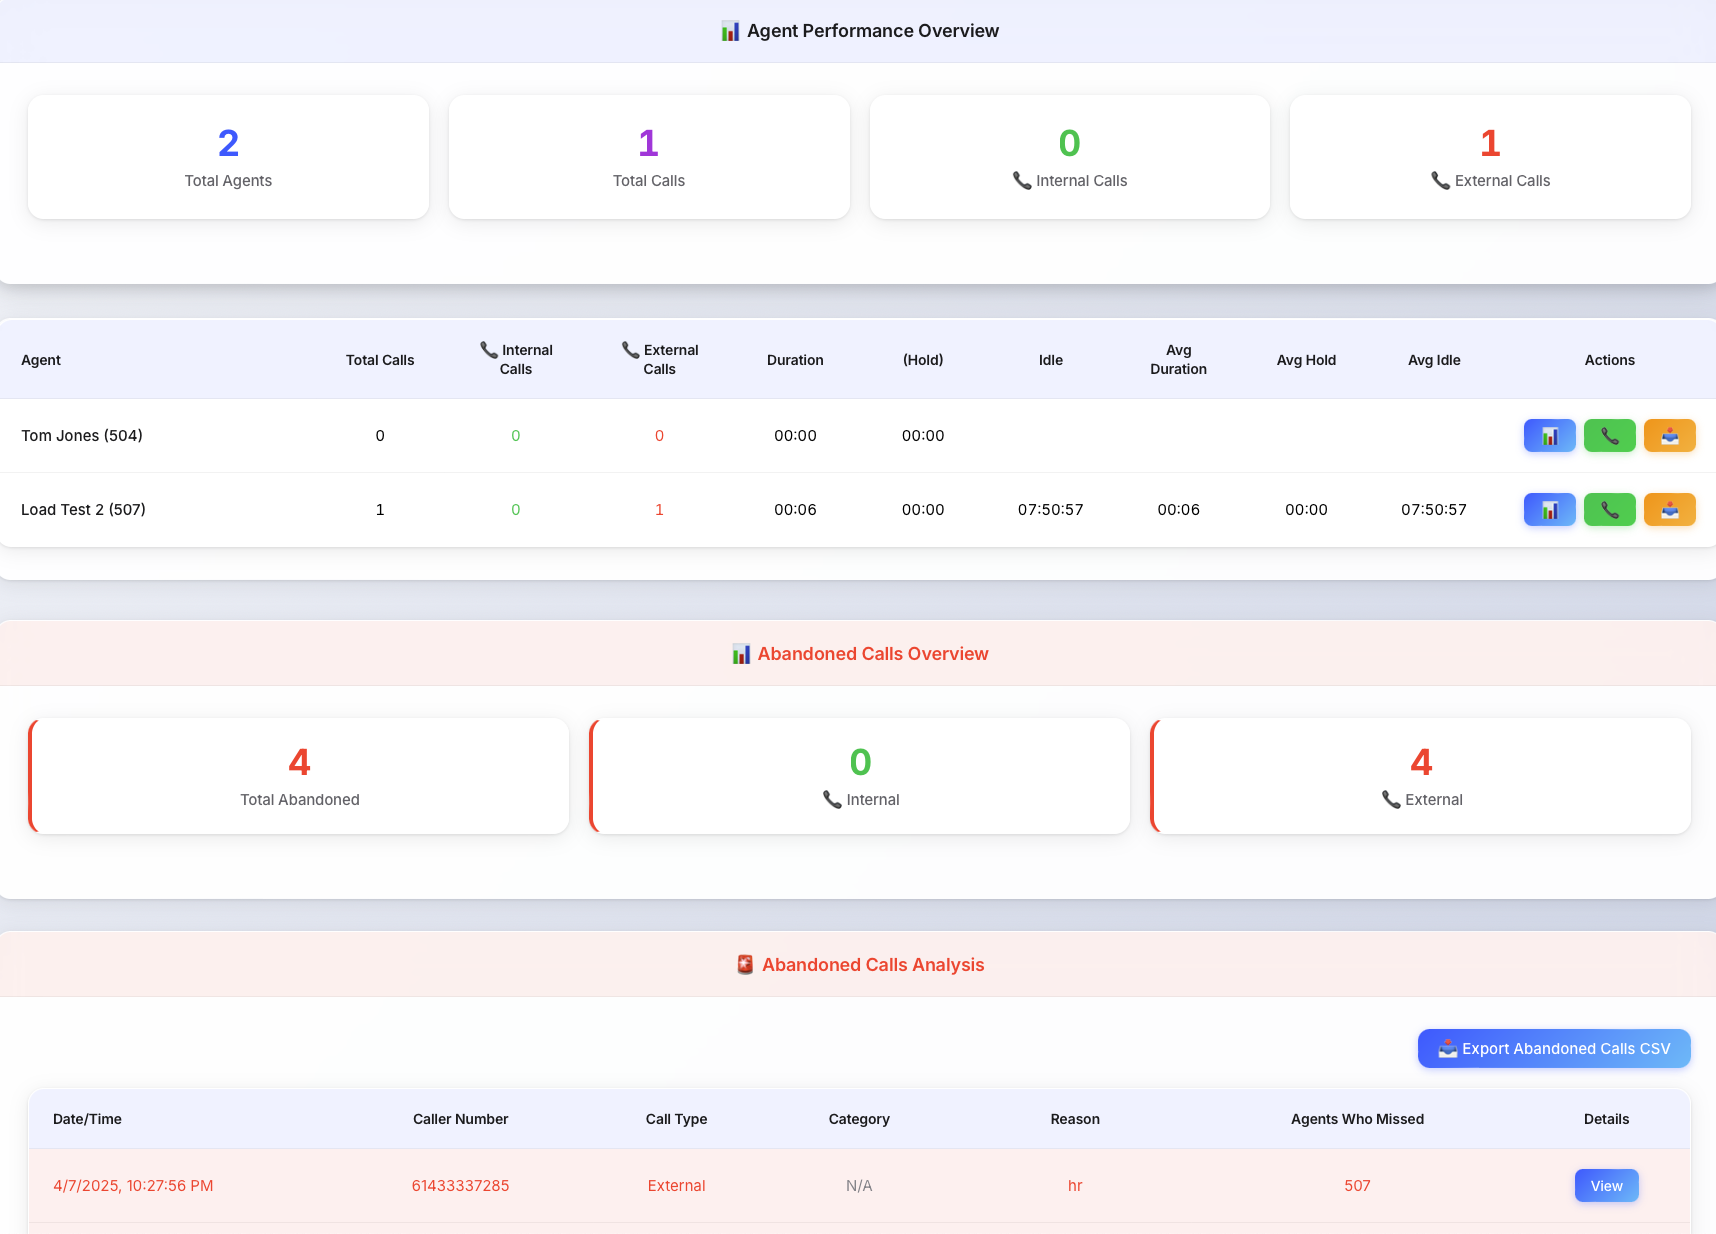
The Vodia Analytics Dashboard is a comprehensive call center analytics dashboard that provides real-time insights into agent performance, abandoned calls, and call categorization.
Key Features
📊 Agent Performance Analytics
- Real-time metrics: Call volumes, durations, hold times, and idle periods
- Call type classification: Automatic internal vs. external call categorization
- Individual agent breakdowns: Detailed performance analysis per agent
- Historical data tracking: Configurable date ranges for trend analysis
🚨 Abandoned Call Management
- Comprehensive tracking: Full details of all abandoned calls
- Root cause analysis: Identifies which agents missed calls and why
- Performance indicators: Color-coded alerts for high-risk patterns
- Category-based insights: Breakdown by call categories
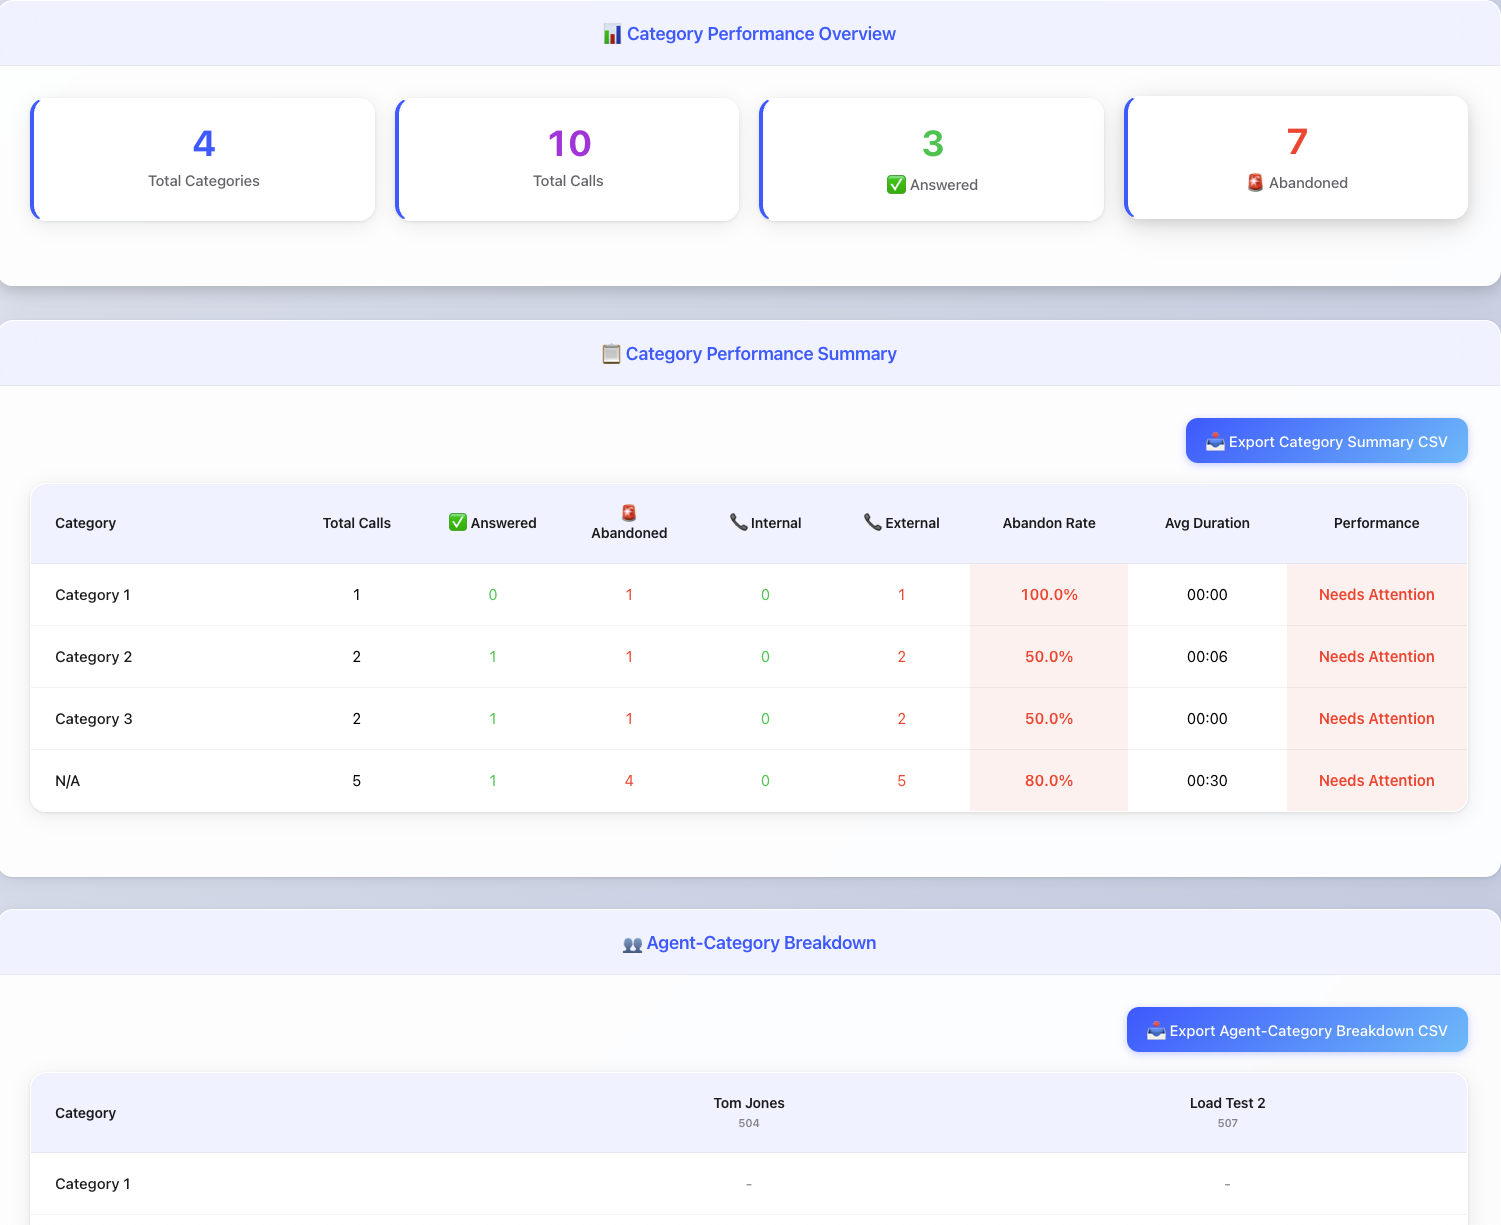
📋 Category Performance Analysis
- Category mapping: Intelligent categorization of incoming calls
- Performance metrics: Success rates, abandon rates, and duration analysis
- Trend identification: Spot patterns in category-specific performance
- Resource optimization: Data-driven insights for staffing decisions
👥 Agent-Category Breakdown
- Matrix visualization: Cross-reference agents with call categories
- Call distribution analysis: See which agents handle specific call types
- Workload balancing: Identify specialization patterns and training needs
- Performance optimization: Data-driven insights for agent assignment
- Total summaries: Agent totals row showing overall call volume per agent
- Export capabilities: Download matrix data for further analysis
📥 Export Capabilities
- CSV exports: Agent performance, abandoned calls, category summaries, and agent-category matrix
- Custom date ranges: Export data for specific time periods
- Multiple formats: Optimized for Excel and data analysis tools
Installation
Setup Instructions
- Version 70.3 and later
- Version 70.2 and earlier
Use the built-in Queue Analytics guided template — the improved, maintained version of this dashboard, so no file download is needed.
- Tenant-wide: open Settings → Custom Home Screen. Single extension: open the extension and select the User Portal tab.
- Under Start from a template, pick Queue Analytics, set the options and Save — the code is generated and the custom home screen is enabled for you.
- To customize the result, edit the generated code in the JavaScript editor on the same page.
See Custom User Portal Home Screen for details.
Older builds do not include the guided template, so install the downloadable file by hand:
- Download the dashboard file: Elegant Glass
- Upload the file as
js/user_portal_custom.jsvia Advanced → Templates → User Portal. - Modify
usr_portal.htm— load the custom script as a module:<!-- Replace this line -->
<script src="js/user_portal_custom.js?v=[[#version]]" async></script>
<!-- With this line -->
<script type="module" src="js/user_portal_custom.js?v=[[#version]]" async></script> - Remove the default component:
<!-- Remove this line -->
<script type="module" src="components/organisms/pbx-home.js?v=[[version]]"></script>
We recommend enabling this analytics dashboard only for extensions that specifically require it. This is because the dashboard generates a significant number of HTTP requests to the PBX to compile statistics, which can impact performance if widely deployed. Therefore, it's best to enable it at the user level for those who genuinely need access to these analytics.
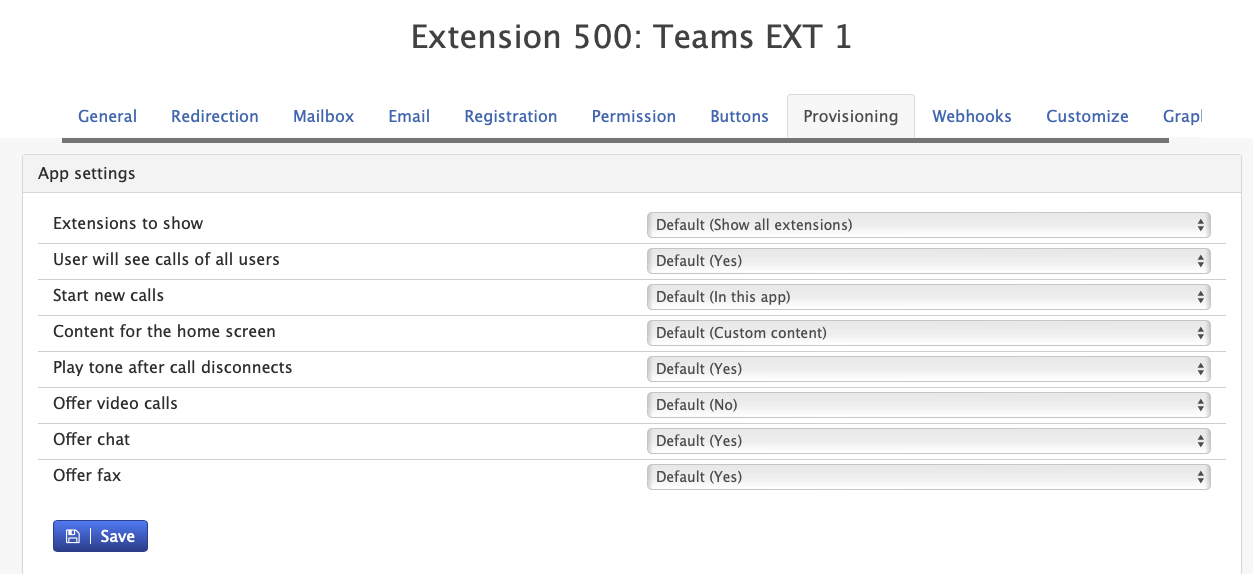
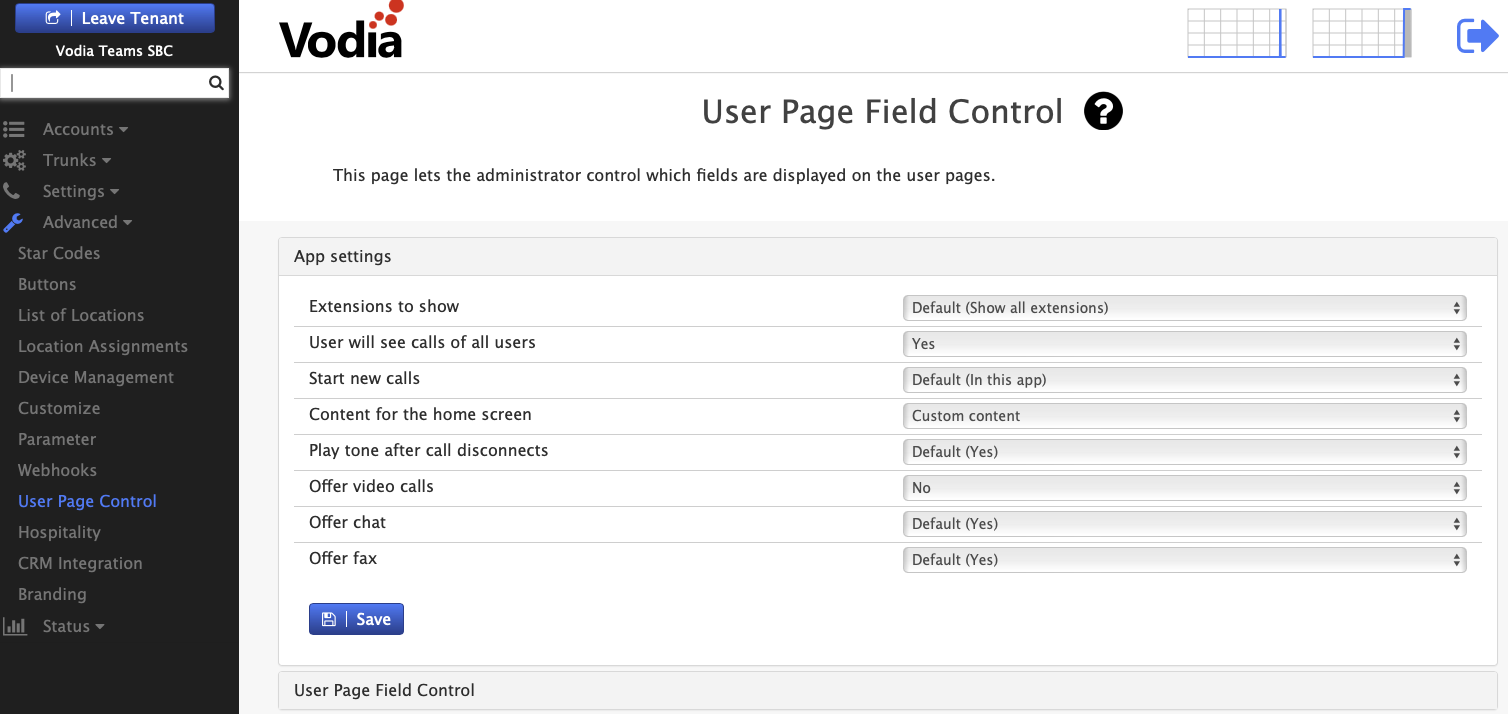
- Enable the custom home screen
- On the same page, turn on Use custom home screen and Save. Choosing a guided template sets this for you automatically.
- A tenant-wide setting applies to all extensions; a per-extension setting overrides the tenant-wide one for that user.
- Version 69
- Version 70

- Version 69
- Version 70

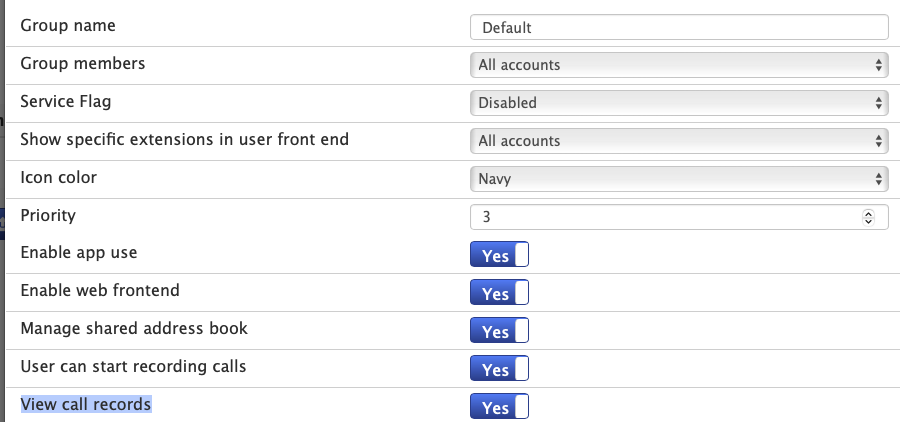
- Enable appropriate Permissions
- Ensure
View call recordspermission is set under Tenant settings -> group for the extensions that will access this dashboard.
- Ensure
Configuration
Call Classification Settings
// Adjust internal call threshold (default: 4 digits)
this.INTERNAL_CALL_DIGIT_THRESHOLD = 4;
- Internal calls: Numbers with fewer digits (extensions, short codes)
- External calls: Numbers with threshold digits or more (phone numbers)
Date Range Configuration
- Default range: Last 7 days
- Maximum range: 400 days of historical data
- Configurable: Start and end dates via settings panel
Usage Guide
1. Dashboard Overview
- Launch the dashboard to see real-time agent performance using Vodia User web portal
- Use the date picker to adjust the analysis period
- Monitor key metrics in the summary cards
2. Agent Analysis
- Click 📊 for detailed call breakdowns
- Click 📞 to view all call details
- Click 📥 to export individual agent data
3. Abandoned Call Investigation
- Review the abandoned calls section for problematic patterns
- Click View to see detailed call information
- Export data for further analysis
4. Category Performance
- Monitor category-specific success rates
- Identify high-abandon rate categories
- Use insights for training and resource allocation
5. Agent-Category Analysis
- Review the agent-category breakdown matrix
- Identify agent specialization patterns
- Monitor workload distribution across categories
- Use the total row to see overall agent performance
- Export matrix data for detailed workforce analysis
Key Metrics Explained
| Metric | Description | Usage |
|---|---|---|
| Total Calls | All calls handled by agents | Overall activity volume |
| Internal/External | Call source classification | Workload distribution |
| Abandon Rate | Percentage of unanswered calls | Service quality indicator |
| Avg Duration | Average call length | Efficiency measurement |
| Hold/Idle Time | Wait times and agent availability | Resource optimization |
| Agent-Category Matrix | Cross-reference of agents and call categories | Specialization and training insights |
Performance Indicators
🟢 Good Performance
- Abandon rate < 10%
- Consistent call handling
- Balanced internal/external ratio
🟡 Monitor
- Abandon rate 10-20%
- Occasional missed calls
- Uneven call distribution
🔴 Needs Attention
- Abandon rate > 20%
- Frequent missed calls
- Poor category performance