Vodia Queue Overview Analytics Dashboard
Overview
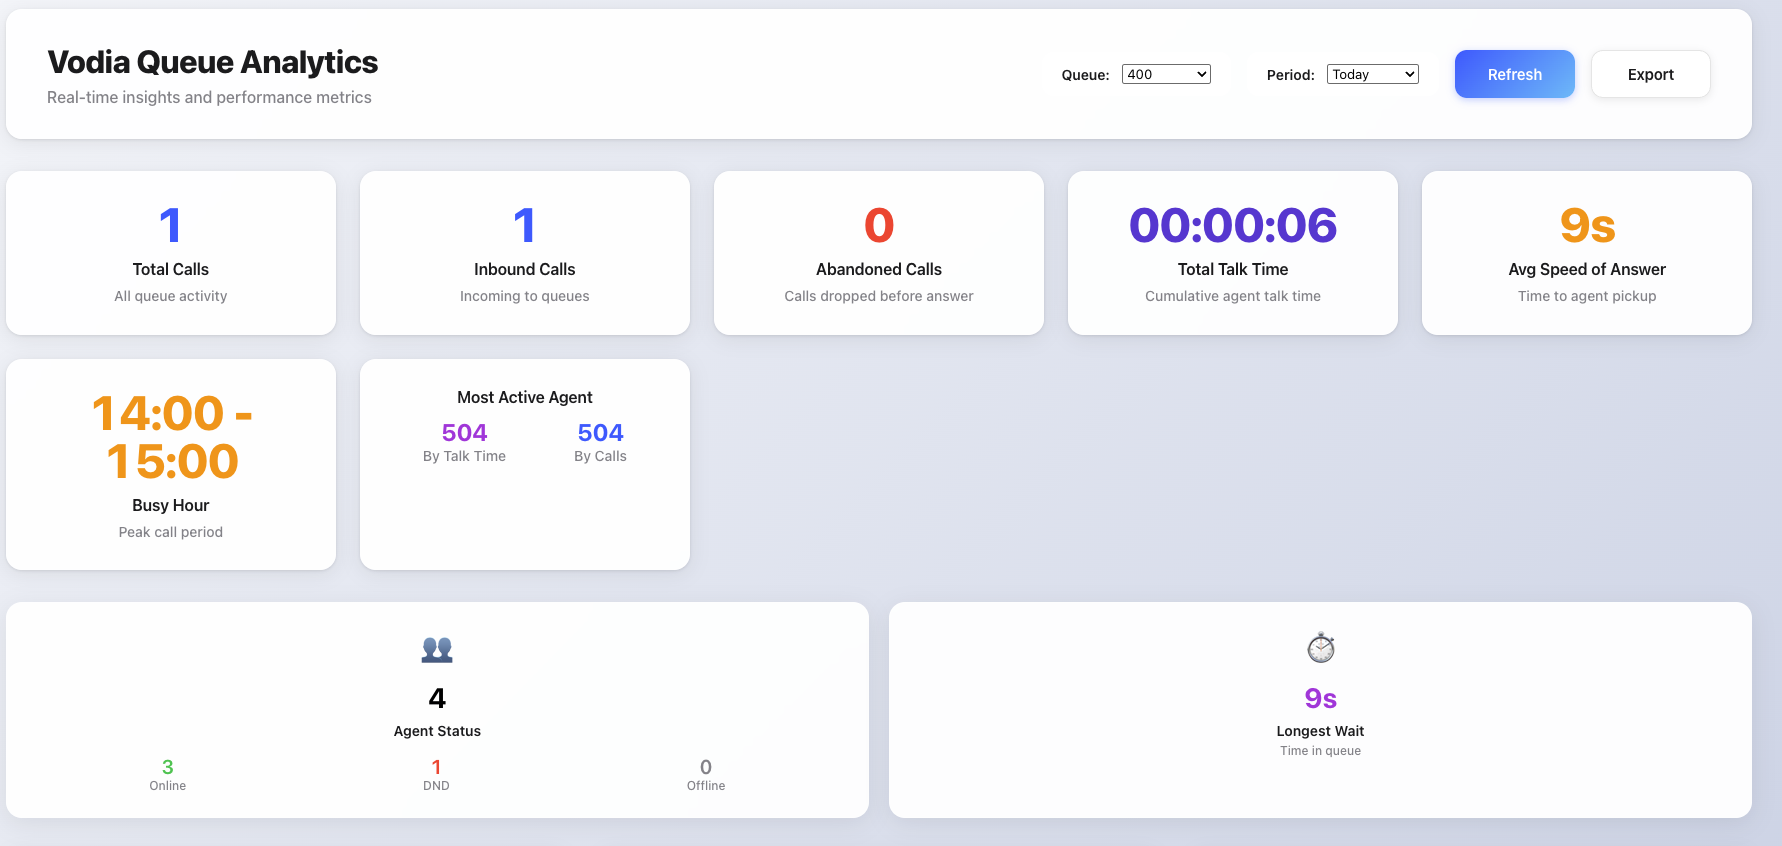
The Vodia Queue Overview Analytics Dashboard provides comprehensive real-time queue performance monitoring and historical analysis. This dashboard delivers actionable insights into queue operations, agent performance, call distribution patterns, and abandonment trends across your call center infrastructure.


Key Features
📊 Real-Time Queue Monitoring
- Queue metrics: Current queue length, wait times, and active call volumes
- Multi-queue support: Monitor all queues or focus on specific queue performance
- Agent status tracking: Real-time visibility into agent login status, DND states, and availability
- Live performance indicators: Instant updates on key performance metrics
📈 Historical Analytics Engine
- Configurable time periods: Today, yesterday, week, month analysis options
- Call volume trends: Hourly distribution patterns and peak period identification
- Performance tracking: Talk time, IVR time, ring time, and wait time analysis
- Abandonment analysis: Daily abandon rate trends and pattern identification
👥 Agent Performance Analytics
- Individual agent breakdowns: Calls handled, talk time, and status monitoring
- Performance ranking: Identification of most active agents by calls and talk time
- Status visualization: Online, DND, and offline agent categorization
- Historical agent stats: Cumulative performance data across selected periods
📋 Interactive Data Visualization
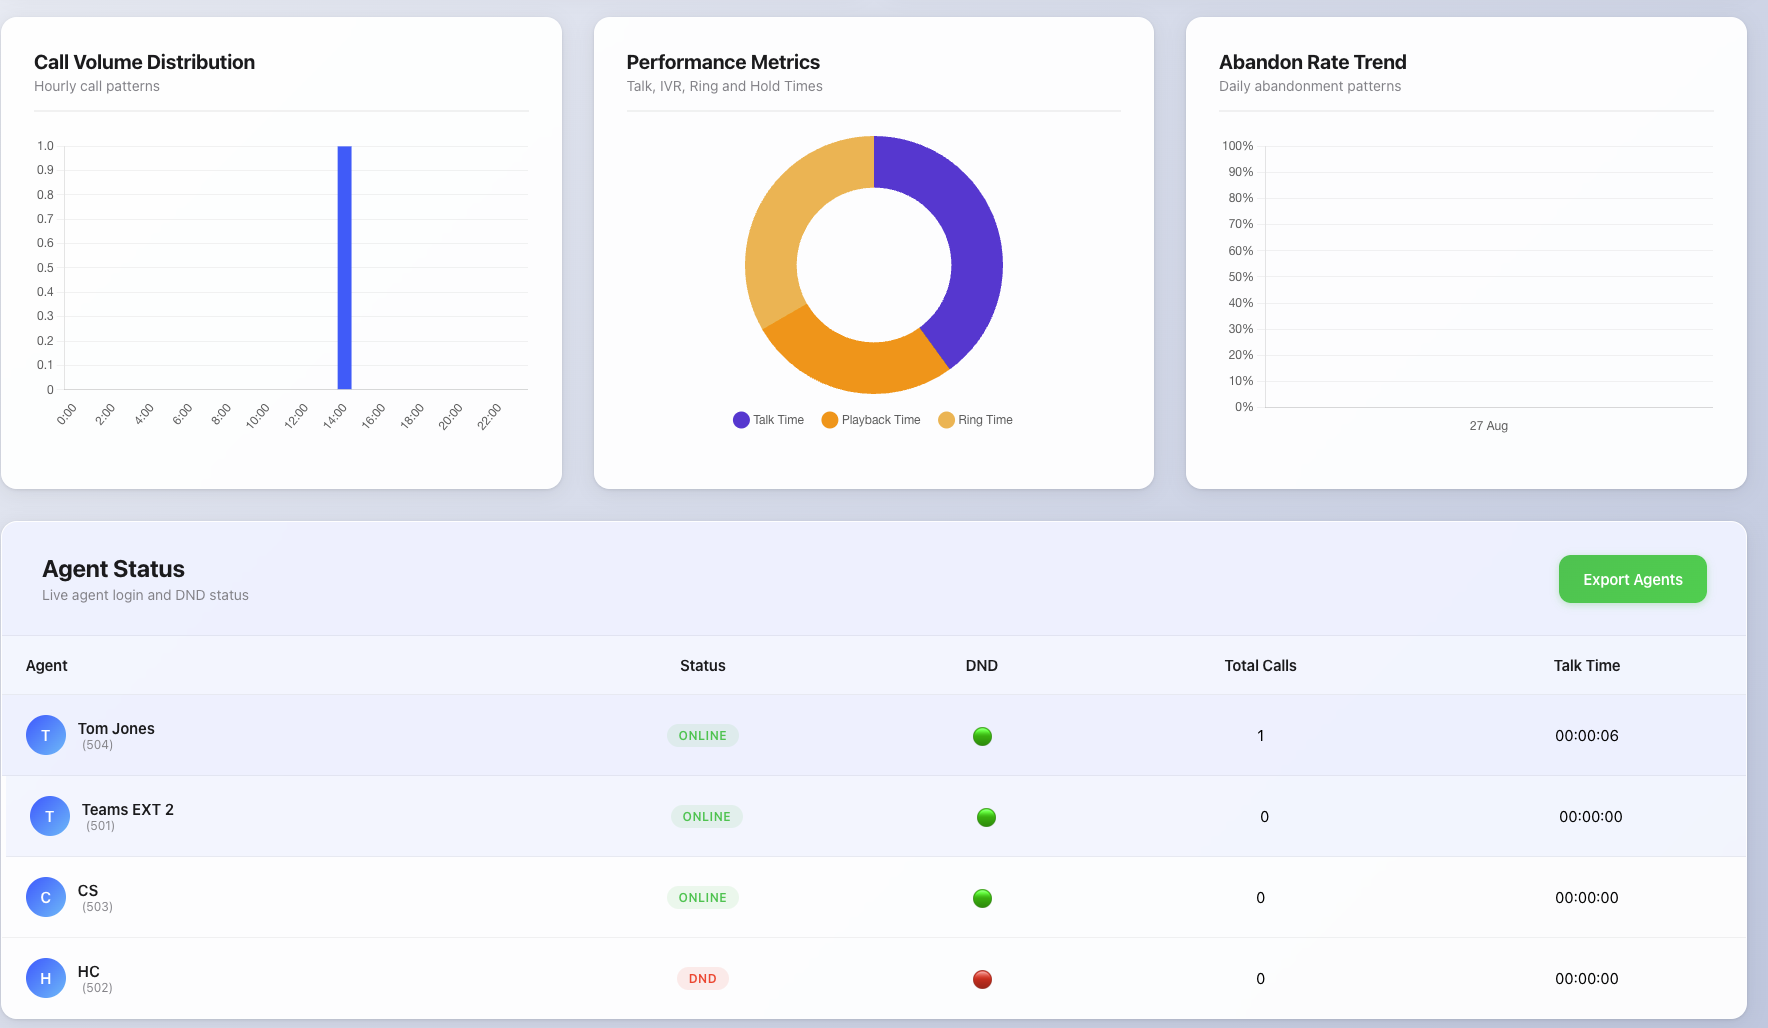
- Call volume charts: Bar charts showing hourly call distribution patterns
- Performance pie charts: Visual breakdown of talk, IVR, and ring time proportions
- Abandon rate trends: Line charts tracking abandonment patterns over time
- Dynamic chart updates: Real-time chart refreshing with new data
🔄 Auto-Refresh & Export
- Automatic data refresh: Configurable 30-second intervals for live updates
- Data export capabilities: JSON export of complete analytics dataset
- Agent data export: Dedicated export functionality for agent performance data
- Historical data preservation: Maintains performance history across refresh cycles
Installation
Setup Instructions
- Download and customize files
- Customize
user_portal_custom.jsat Tenant or User Level. Here is the link to download the JS file: Queue Analytics Dashboard - Modify
usr_portal.htm:
<!-- Replace this line -->
<script src="js/user_portal_custom.js?v=[[#version]]" async></script>
<!-- With this line -->
<script type="module" src="js/user_portal_custom.js?v=[[#version]]" async></script>- Remove the default component:
<!-- Remove this line -->
<script type="module" src="components/organisms/pbx-home.js?v=[[version]]"></script> - Customize
Performance Considerations
This queue analytics dashboard makes extensive API calls to compile real-time statistics. We recommend deploying it selectively for users who require queue monitoring capabilities. Consider the server load impact when enabling for multiple concurrent users.
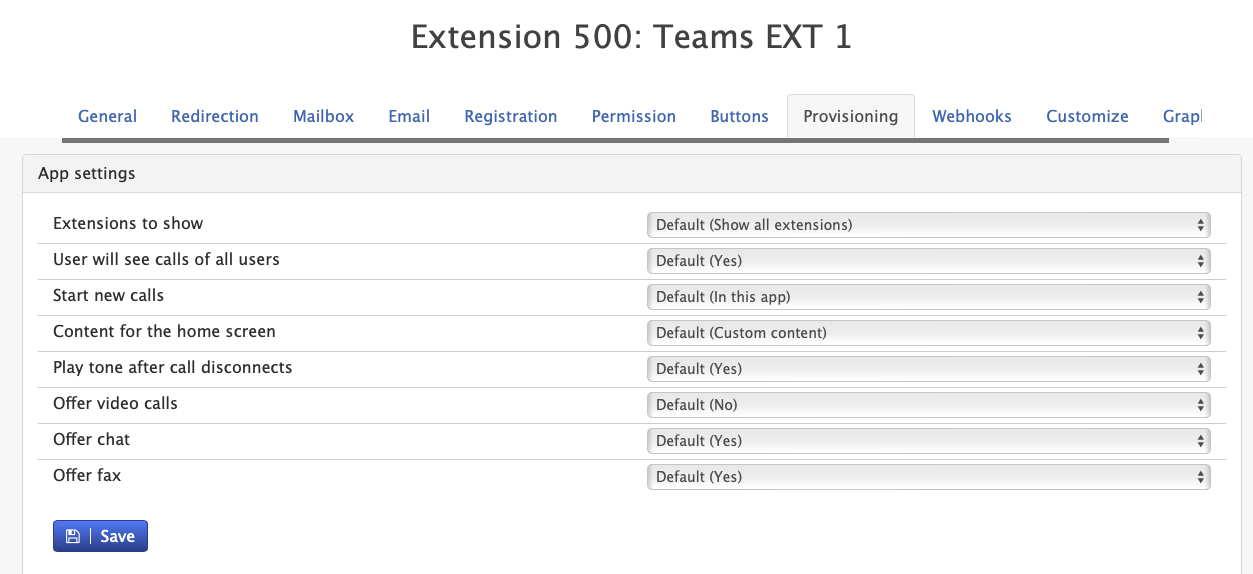
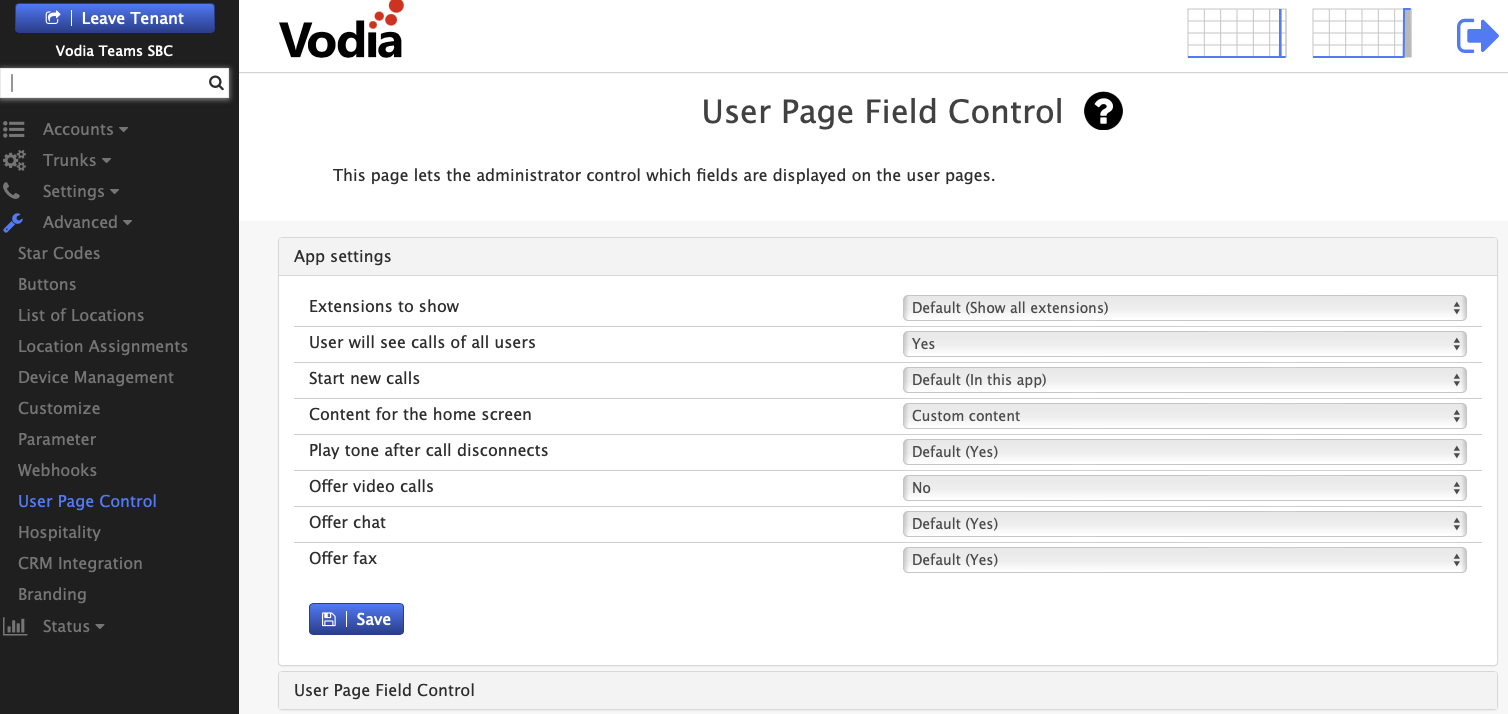
- Enable Custom Homescreen
- At extension or tenant level, set Content for the home screen to Custom Content
- Navigate to Tenant -> Advanced -> User Page Control OR Extension settings -> Provisioning Tab/User Page Field Control -> User Page Control
- Version 69
- Version 70


- Version 69
- Version 70


- Configure Required Permissions
- Ensure Call records and Queue permissions is enabled under Tenant settings -> group
Configuration
Refresh Interval Configuration
// Auto-refresh settings (default: 300 seconds)
this.refreshInterval = 300000;
- Configurable intervals: Adjust refresh frequency based on requirements
- Manual refresh: On-demand data refresh capability
Time Period Settings
- Default period: Today's data analysis
- Available ranges: Today, Yesterday, This Week, Last Week, This Month
- Historical depth: Up to 30 days of historical analysis
- Dynamic date ranges: Real-time period switching
Usage Guide
1. Dashboard Overview
- Launch the dashboard to view real-time queue performance metrics
- Use the queue selector dropdown to focus on specific queues or view all
- Monitor key performance indicators in the metric cards at the top
2. Time Period Analysis
- Select different time periods using the period dropdown
- View historical trends and patterns across different timeframes
- Compare current performance against historical baselines
3. Real-Time Monitoring
- Monitor live agent status and queue lengths
- Track current wait times and active call volumes
- Observe real-time changes in agent availability and DND status
4. Performance Analysis
- Review call volume distribution charts to identify peak periods
- Analyze talk time, IVR time, and ring time proportions
- Monitor abandon rate trends to identify problem patterns
5. Agent Management
- Review individual agent performance in the agent breakdown table
- Identify top-performing agents by calls handled and talk time
- Monitor agent status and availability for workforce management
6. Data Export
- Export complete analytics dataset using the main export button
- Export agent-specific data using the dedicated agent export function
- Save historical data for external analysis and reporting
Key Metrics Explained
| Metric | Description | Usage |
|---|---|---|
| Total Calls | All calls processed by selected queues | Overall queue activity volume |
| Inbound Calls | Successfully answered queue calls | Service delivery measurement |
| Abandoned Calls | Calls dropped before agent pickup | Service quality indicator |
| Total Talk Time | Cumulative agent conversation time | Agent productivity measurement |
| Avg Speed of Answer | Average time from queue entry to pickup | Service efficiency indicator |
| Busy Hour | Peak call volume period identification | Resource planning insight |
| Most Active Agent | Top performer by talk time and call volume | Performance recognition |
| Agent Status | Current online, DND, and offline counts | Staffing availability overview |
| Longest Wait | Current maximum queue wait time | Real-time service level indicator |
Chart Types & Analysis
📊 Call Volume Distribution
- Hourly patterns: 24-hour call volume visualization
- Peak identification: Automatic busy hour calculation
- Trend analysis: Historical volume pattern recognition
- Capacity planning: Resource allocation insights
🥧 Performance Metrics Breakdown
- Time allocation: Talk, IVR, and ring time proportions
- Efficiency analysis: Agent utilization measurements
- Resource optimization: Identify areas for improvement
- Visual comparison: Easy-to-read pie chart format
📈 Abandon Rate Trends
- Daily tracking: Abandonment patterns over time
- Threshold monitoring: Identify concerning trends
- Performance indicators: Color-coded alert levels
- Historical comparison: Track improvement over periods
Technical Requirements
Browser Compatibility
- Modern browsers with ES6 module support
- WebGL support for advanced chart rendering
- Local/session storage for configuration persistence