Prometheus documentation
Prometheus intergration
Prometheus is an open-source monitoring and alerting toolkit of the Cloud Native Computing Foundation. By integrating it with Vodia PBX, you can effectively monitor and manage your phone system's performance. Here’s how to get started:
Step 1: Create an API Account on Vodia PBX
Vodia PBX version 69 and higher
To allow Prometheus to access Vodia PBX data, you need to create an API administrator account
Log in to Vodia PBX as an Administrator:
Navigate to the system level where you can manage user accounts. Create a New User Account for API Access:
Go to Settings, Security, Administrators Create a new account with the following details: Account: Choose a user name. API Access: Enable API access. Type: Set the account type to Regular. Password: Set a strong, secret password. Save the Configuration:
Save the user account configuration. Keep the username and password handy, as you will need them for Prometheus to access Vodia PBX data.
Installing Prometheus on Digital Ocean
Digital Ocean's marketplace has Prometheus available today, https://marketplace.digitalocean.com/apps/prometheus
Once your server is set up, you can access the Prometheus user interface by going to: http://your_server_ip:9090/
However, you will need access to the file via SSH to configure the .yml file.
Setting up the .yml file
By default, Prometheus is set up to monitor itself and Node Exporter. To monitor more systems, you need to update the configuration file located at: /etc/prometheus/prometheus.yml
Prometheus sample configuration
# my global config
global:
  scrape_interval: 15s # Set the scrape interval to every 15 seconds. Default is every 1 minute.
  evaluation_interval: 15s # Evaluate rules every 15 seconds. The default is every 1 minute.
  # scrape_timeout is set to the global default (10s).

# Alertmanager configuration
alerting:
  alertmanagers:
    - static_configs:
        - targets:
          # - alertmanager:9093

# Load rules once and periodically evaluate them according to the global 'evaluation_interval'.
rule_files:
  # - "first_rules.yml"
  # - "second_rules.yml"

# A scrape configuration containing exactly one endpoint to scrape:
# Here it's Prometheus itself.
scrape_configs:
  # The job name is added as a label `job=<job_name>` to any timeseries scraped from this config.
  - job_name: "stats"
    scrape_interval: 10s
    static_configs:
      - targets: ['nyc.vodia.com']
        labels:
          group: 'apis'
    scheme: https
    metrics_path: /rest/system/stats
    params:
      type: ['exposition-format']
    basic_auth:
      username: 'prometheus'
      password: 'prometheus'
    # metrics_path defaults to '/metrics'
    # scheme defaults to 'http'.
3 things need to be changed in the Prometheus .yml file config file
*targets: ['123.vodia.com'] Here is where you will set the target PBX DNS name
*username: 'prometheus'
*password: 'prometheus'
*Note: Do not remove the ' ' and [ ] in the config file. leave it as is and change the value
Once you have edited the config file, restart the Prometheus
To restart the Prometheus service use sudo systemctl restart Prometheus
How to use Vodia API
Here we have a list of APIs you can use with Prometheus
Vodia API Check the Prometheus and click on System Stats, This will show all of the available APIs for Prometheus, and you will see an Example Response, click "view more" and it should show something like this
Here are some stats examples you can use with Prometheus
system_cpu_srv_max
system_cpu_srv_avg
system_cpu_ctrl_max
system_cpu_ctrl_avg
system_memory_all
system_memory_tcp_syn
Creating a stat panel on Prometheus
Click the add panel button and enter the Vodia API cmd, in this case, system_cpu_srv_max then press execute, you can create many panels to monitor the PBX, copy-paste, for example, ssystem_memory_tcp_syn
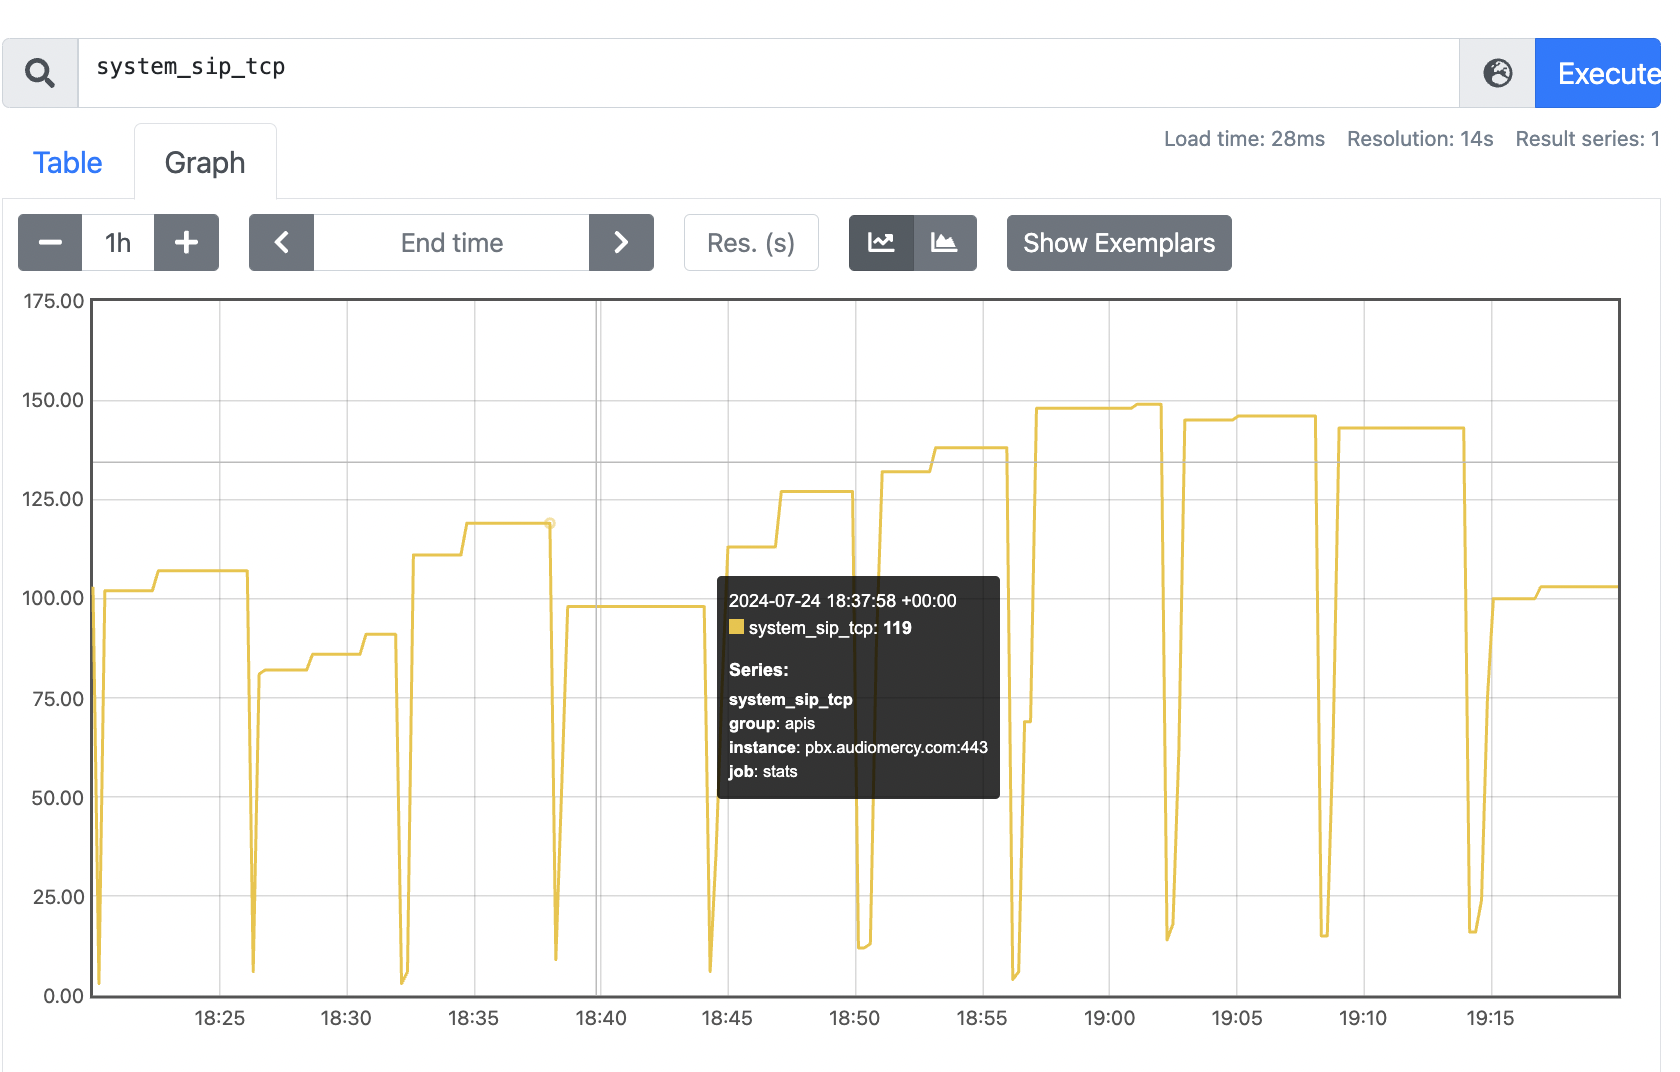
Here's another example using system_sip_tcp
