Uptime
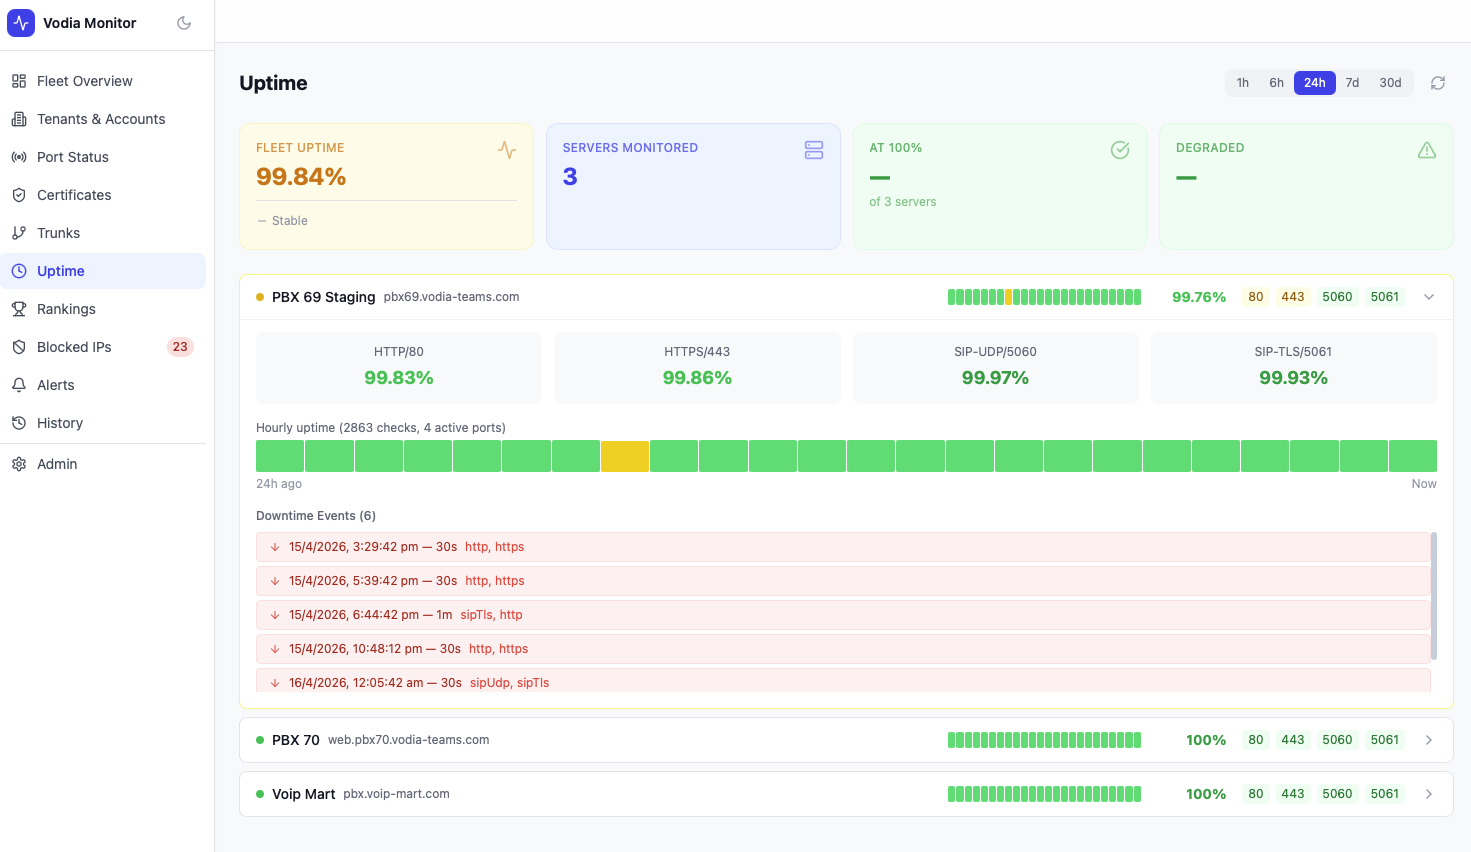
The Uptime page tracks per-server and per-port availability over time, showing uptime percentages, hourly heatmaps, and a full downtime event log.
Time Range
Select the period to analyse using the tabs at the top: 1h · 6h · 24h · 7d · 30d.
Summary Cards
| Metric | Description |
|---|---|
| Fleet Uptime | Aggregate uptime percentage across all servers and ports |
| Servers Monitored | Total servers included in calculations |
| At 100% | Count of servers with no downtime in the selected period |
| Degraded | Servers with at least one port outage |
Per-Server Uptime
Each server has its own section showing:
- Overall uptime % for the server
- Per-port uptime % for HTTP/80, HTTPS/443, SIP-UDP/5060, SIP-TLS/5061
- Hourly heatmap — a colour-coded bar showing uptime per hour across the selected period. Each bucket represents one hour; colour intensity indicates the proportion of checks that succeeded. The number of total checks and active ports are shown below the heatmap.
- Downtime Events — a chronological list of outage events, each showing timestamp, duration, and which ports were affected
Downtime Events
Each downtime event shows:
- Timestamp — when the outage started
- Duration — how long the outage lasted (e.g.
30s,1m) - Affected ports — which ports were down (e.g.
http, httpsorsipUdp, sipTls)
note
Records with a disabled status are excluded from uptime percentage calculations and heatmap rendering. Only active monitoring periods are counted.