Fleet Overview
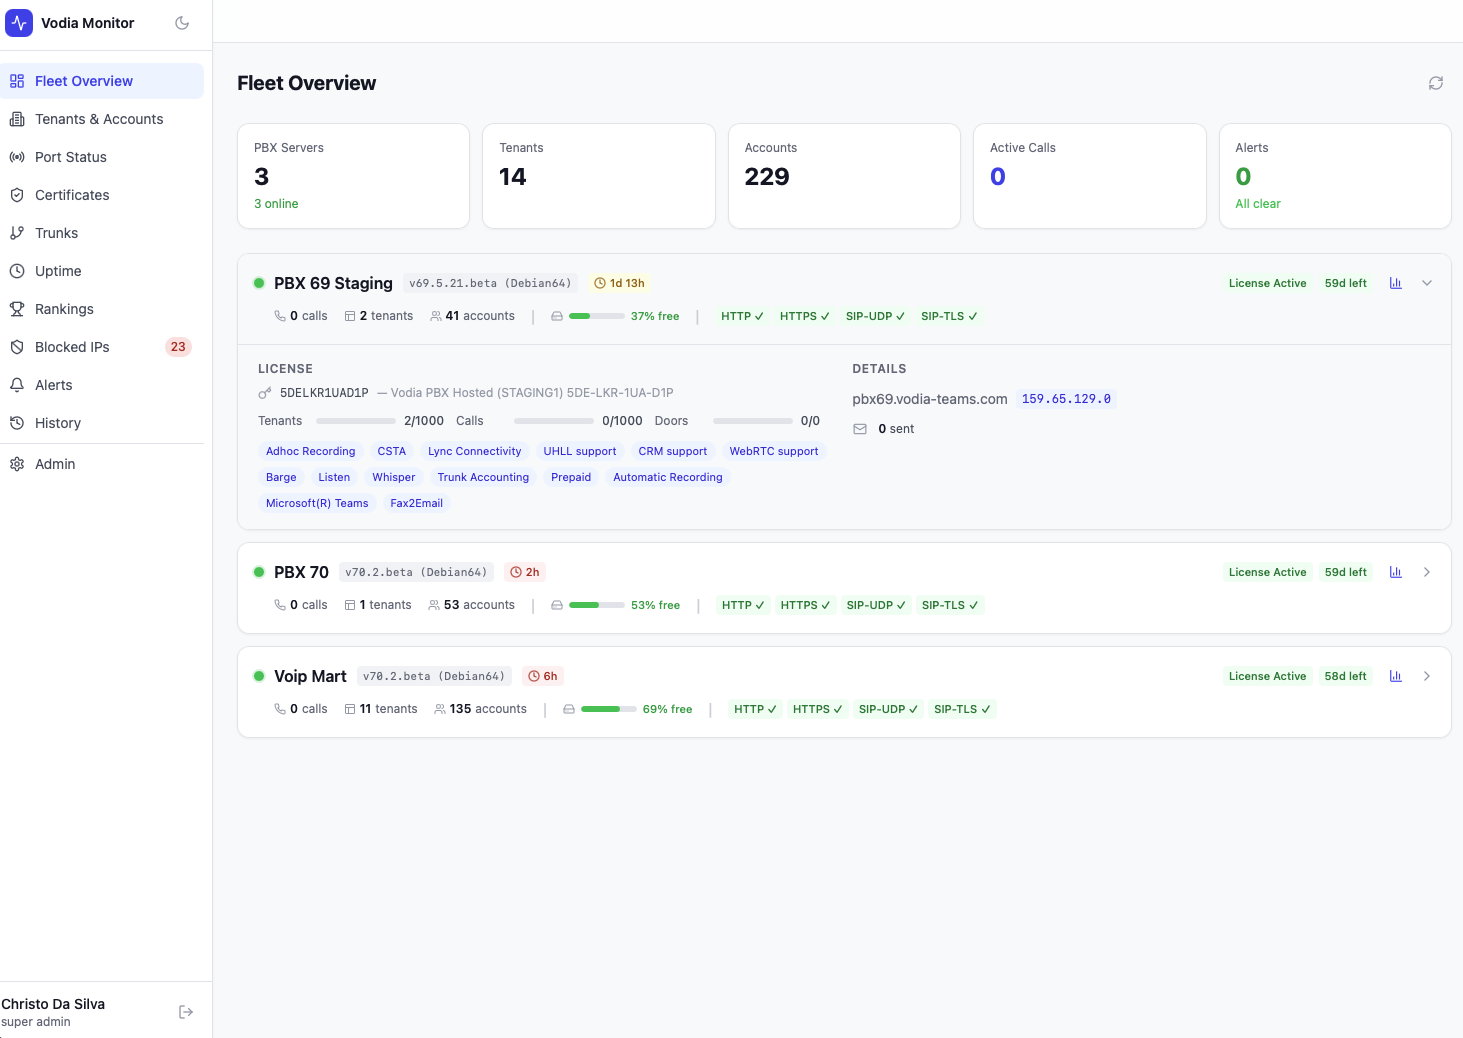
The Fleet Overview is the home screen of Vodia Monitor. It provides an at-a-glance summary of every PBX server in your fleet, with key health indicators surfaced directly on each server card.
Summary Bar
The top of the page shows fleet-wide totals:
| Metric | Description |
|---|---|
| PBX Servers | Total servers monitored, with online count |
| Tenants | Total PBX domains across all servers |
| Accounts | Total accounts (all types) across all tenants |
| Active Calls | Current calls in progress fleet-wide |
| Alerts | Count of open alerts; shows "All clear" when none |
PBX Server Cards
Each server in the fleet gets its own card showing:
- Version & platform — e.g.
v70.2.beta (Debian64) - Uptime — time since last restart (e.g.
4h,1d 11h) - License status — Active/Expired with days remaining
- Active calls — current call count
- Tenants & accounts — counts for this server
- Disk usage — percentage free shown as a visual bar
- Port health — HTTP, HTTPS, SIP-UDP, SIP-TLS status inline (✓ / ✗)
One-Click Admin Login
Super admins see a login button on each server card that opens the PBX admin interface in a new tab, already authenticated. Monitor mints a short-lived admin session server-side using the stored PBX credentials, so no passwords need to be looked up or typed.
On v70 and later this works out of the box. On v69, a small one-time shim (autologin.htm + autologin.js) must be hosted on the PBX, because Vodia requires session activation from the PBX's own origin. If the shim is missing, Monitor detects this and displays step-by-step install instructions instead of failing.
Using Fleet Overview
The Fleet Overview is designed for a quick operational check. If any port shows ✗ or a license is near expiry, you can navigate directly to the relevant detail page (Port Status, Certificates, Alerts) for more information.
For deeper per-server metrics — CPU, memory, registrations, email delivery counts — click through to the individual PBX or check the Rankings page.