Vodia Queue Agents Performance Report
Overview
The Vodia Queue Agents Performance Report provides comprehensive agent call activity tracking with daily breakdowns across all queue operations. This streamlined dashboard delivers clear insights into agent productivity, call direction patterns (outbound vs inbound), and queue distribution without complex filtering requirements.
Key Features
📊 Automated All-Queue Monitoring
- Automatic queue inclusion: Monitors all available call queues without manual selection
- Cross-queue visibility: Complete view of agent activity across entire queue infrastructure
- Unified reporting: Single dashboard for all queue operations
- Zero configuration: No queue filtering required
📈 Agent Performance Overview
- Total agents: Active agent count across all queues
- Total calls: Cumulative call volume across all agents and queues
- Outbound answered: Agent-initiated calls successfully completed
- Inbound answered: Incoming queue calls successfully handled
- Real-time metrics: Performance indicators updated with each data refresh
📋 Queue Performance Breakdown
- Per-queue statistics: Individual queue call volumes and direction breakdown
- Active agent tracking: Number of agents handling calls per queue
- Call direction analysis: Outbound vs inbound split for each queue
- Queue comparison: Easy identification of high-volume queues
👥 Daily Agent Performance Tracking
- Daily call breakdown: Outbound/Inbound counts for each day over 7 days
- Individual agent totals: Cumulative performance across selected period
- Trend identification: Spot patterns in agent activity over time
🎯 Intelligent Call Direction Detection
- Outbound calls: Agent in FROM field making external calls
- Inbound calls: External caller connecting to agent
- Answered calls only: Excludes abandoned and unanswered calls
🔄 Data Export & Refresh
- CSV export: Complete agent performance data with daily breakdowns
- Manual refresh: On-demand data updates
Installation
Setup Instructions
- Download the dashboard file
- Here is the link to download the JS file: Vodia Queue Agents Performance Report
PBX version
The file-installation step differs by version. Use the Version 70.3 and later tab for the simplified flow; on Version 70.2 and earlier follow the legacy tab.
- Version 70.3 and later
- Version 70.2 and earlier
- Upload it as the custom home module
- At Tenant level, go to Advanced → Templates, select the User Portal template type, and select
js/user_portal_custom.jsas the page. - Paste the downloaded file's contents and save.
- At Tenant level, go to Advanced → Templates, select the User Portal template type, and select
- Upload the file as
js/user_portal_custom.jsvia Advanced → Templates → User Portal. - Modify
usr_portal.htm— load the custom script as a module:<!-- Replace this line -->
<script src="js/user_portal_custom.js?v=[[#version]]" async></script>
<!-- With this line -->
<script type="module" src="js/user_portal_custom.js?v=[[#version]]" async></script> - Remove the default component:
<!-- Remove this line -->
<script type="module" src="components/organisms/pbx-home.js?v=[[version]]"></script>
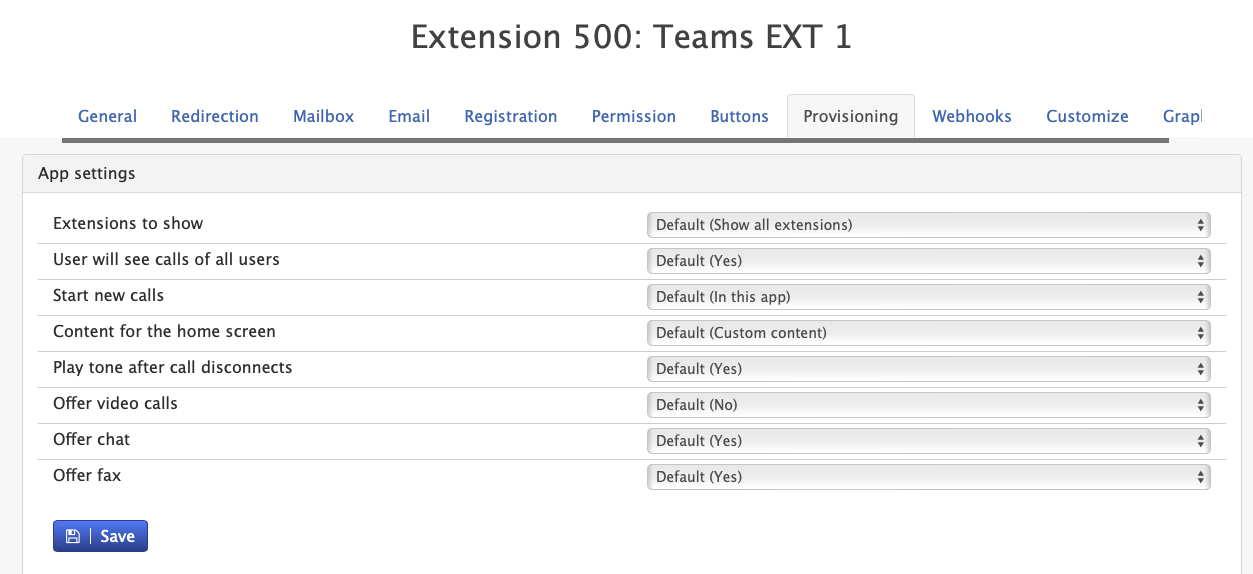
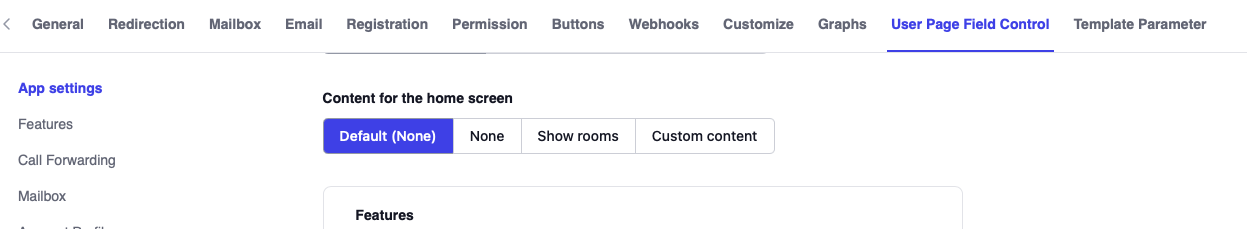
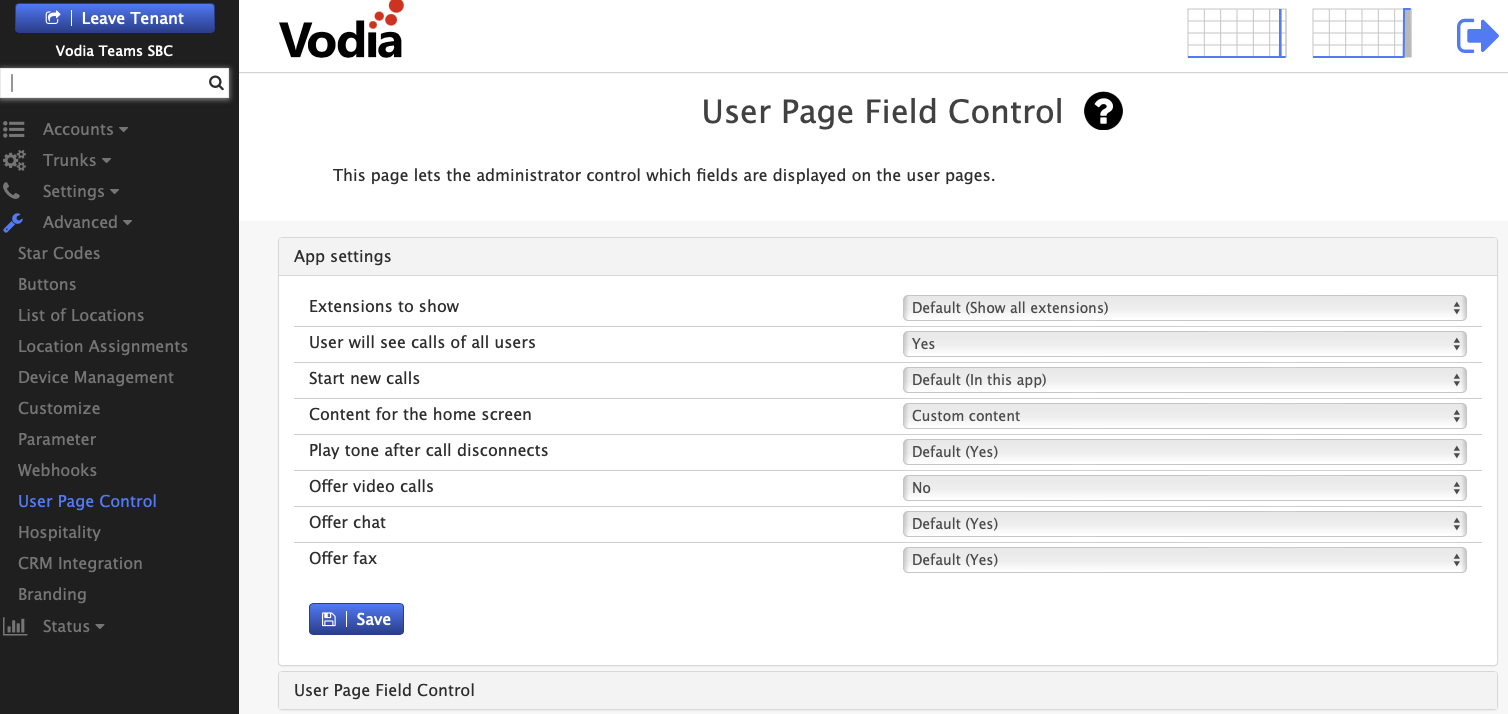
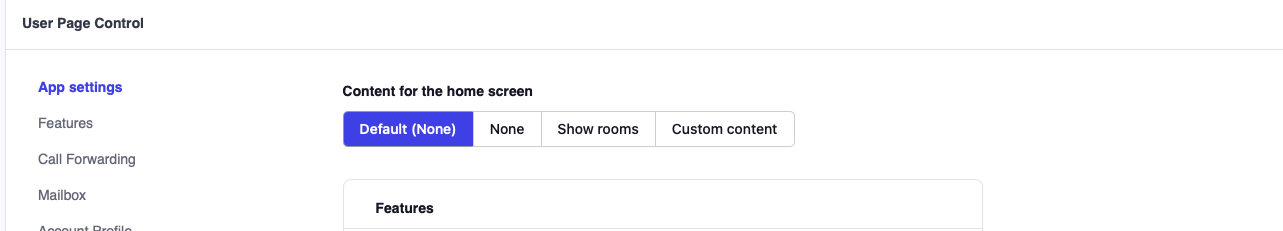
- Enable Custom Homescreen
- Set Content for the home screen to Custom Content. This can be applied tenant-wide (all extensions) or to a specific extension — extensions inherit the tenant-wide setting unless individually overridden.
- Tenant-wide: Tenant → Advanced → User Page Control
- Single extension: open the extension → User Page Field Control tab
- Version 69
- Version 70
- Version 69
- Version 70
- Configure Required Permissions
- Ensure Call records and Queue permissions is enabled under Tenant settings -> group
Report Sections
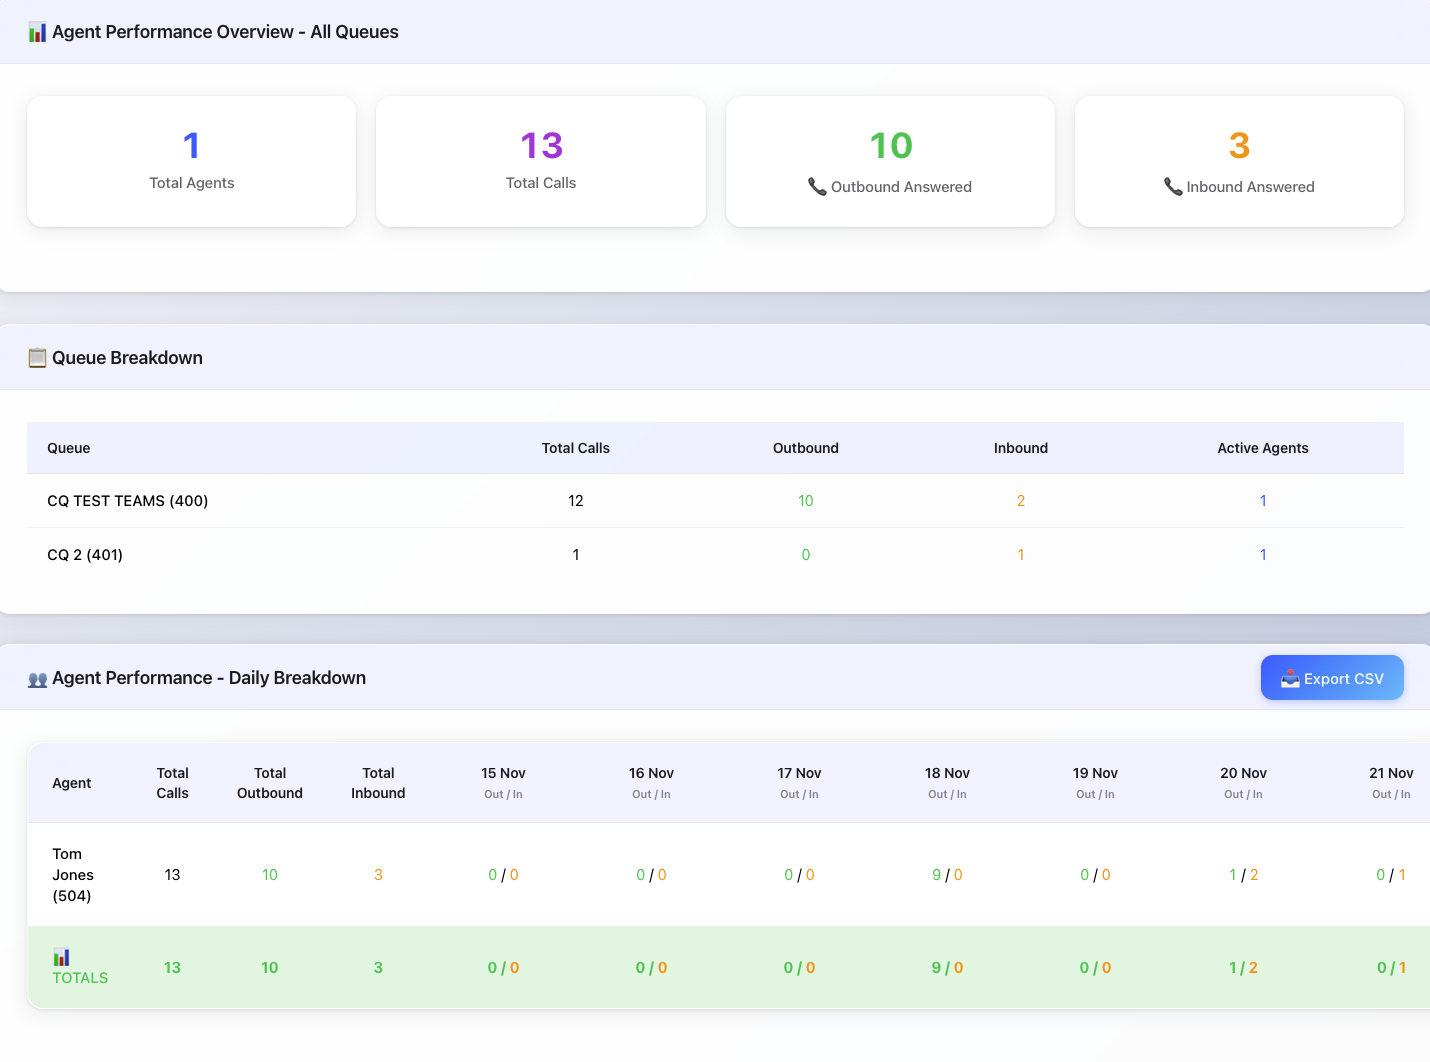
📊 Agent Performance Overview
- Purpose: High-level summary across all queues and agents
- Metrics: 4 summary cards with totals
- Update frequency: Refreshes with each data load
- Scope: Entire date range selected
📋 Queue Breakdown
- Purpose: Per-queue performance visibility
- Columns: Queue name, total calls, outbound, inbound, active agents
- Sorting: Displays all queues with activity
- Color coding: Green (outbound), Orange (inbound), Blue (agents)
👥 Agent Performance - Daily Breakdown
- Purpose: Individual agent productivity tracking
- Structure: Agent rows with daily columns
- Format: Each day shows "Outbound / Inbound" split
- Totals: Bottom row sums all agent activity
- Navigation: Horizontal scroll for extended date ranges
Technical Requirements
System Requirements
- Vodia PBX version 69.0 or higher
- Call history/CDR data retention enabled
Browser Compatibility
- Modern browsers with ES6 module support
- JavaScript enabled
- Minimum 1280px screen width recommended for daily columns
- CSV download capability
Data Requirements
- Call records: Must have talk time > 0
- Queue assignment: Calls must have queue field populated