Dashboard
The Dashboard provides a real-time overview of your call activity across all connected PBX systems.
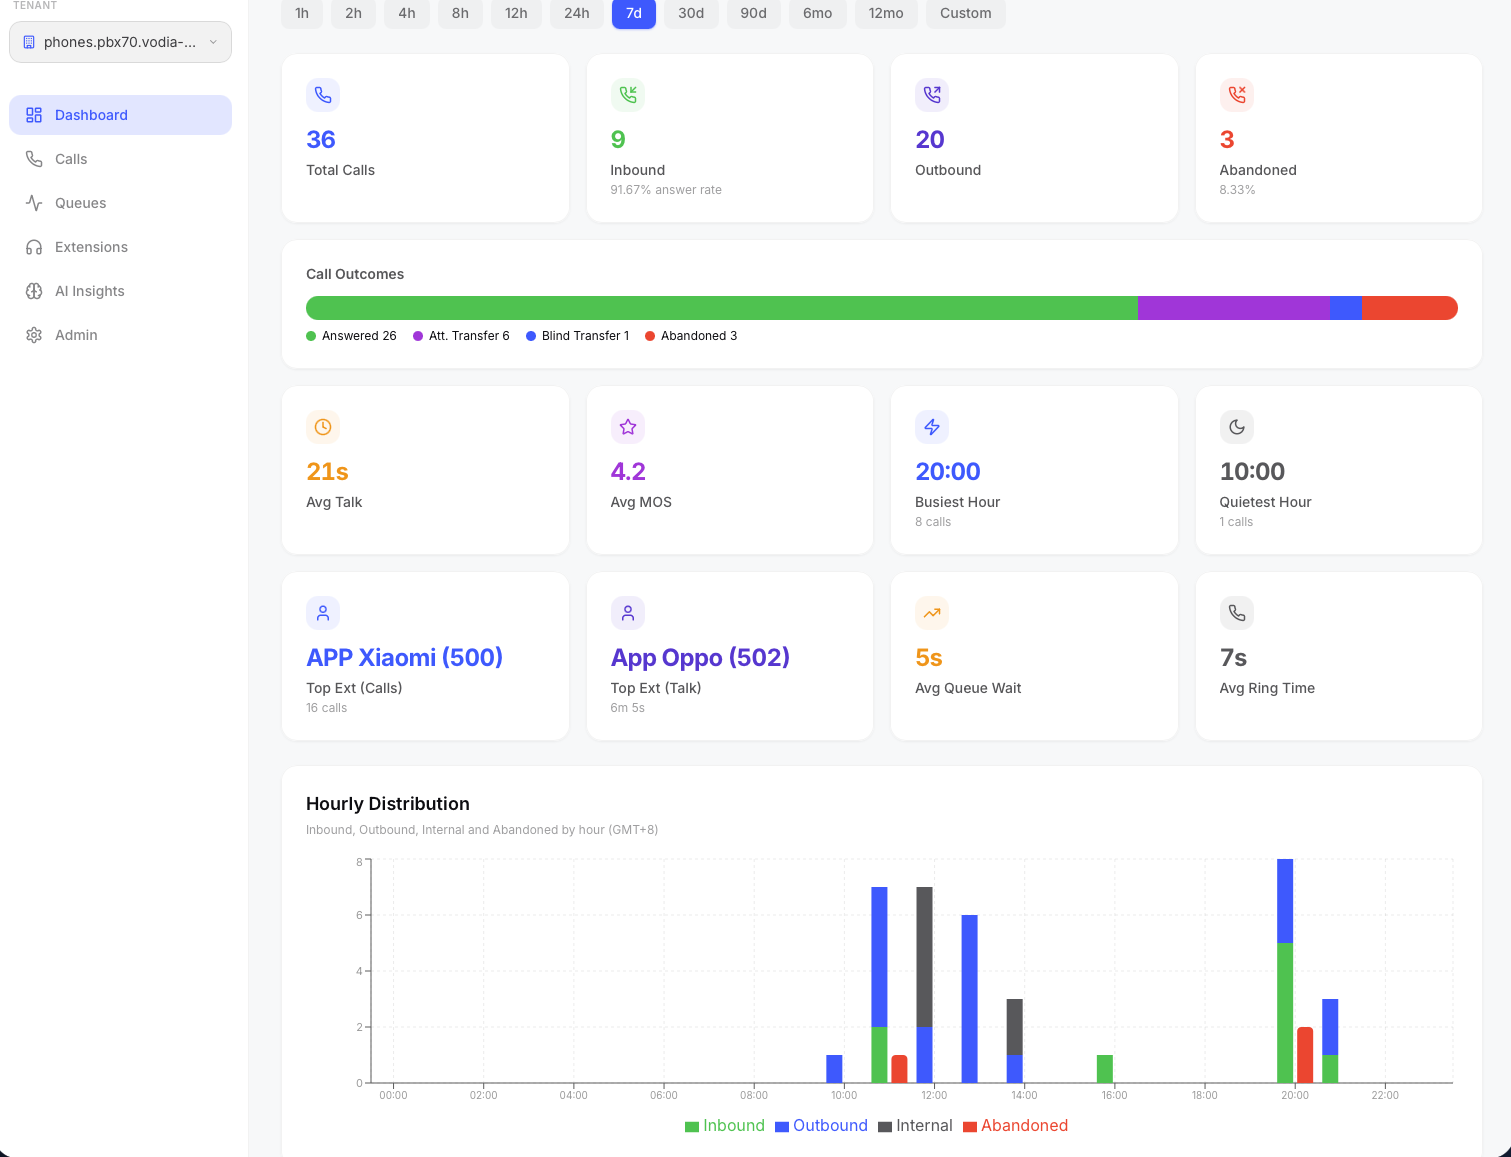
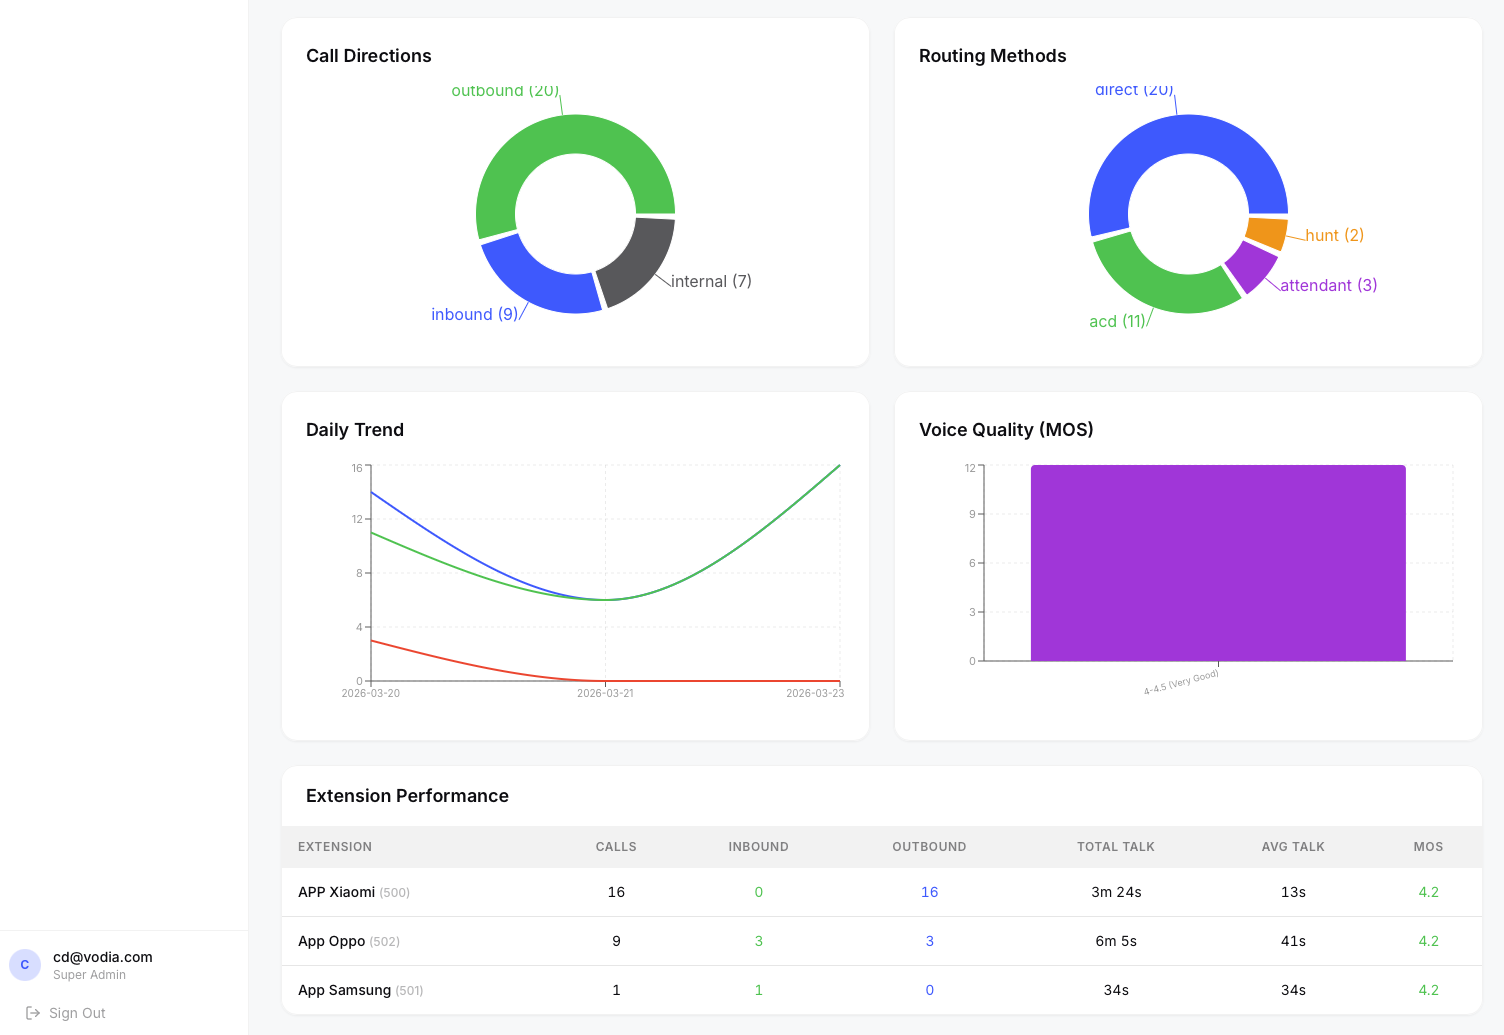
Dashboard showing KPI cards, hourly distribution, and performance tables.
KPI Cards
The top row displays key metrics for the selected time period:
- Total Calls — all calls (inbound, outbound, internal)
- Inbound — calls received from external numbers
- Outbound — calls placed to external numbers
- Abandoned — calls that rang but were not answered
- Avg Talk Time — average duration of answered calls
- Avg MOS — average Mean Opinion Score (voice quality, scale 1–5) Below the main KPIs, additional insight cards show:
- Busiest Hour — the hour of day with the most calls
- Quietest Hour — the hour with the fewest calls
- Top Extension by Calls — the extension handling the most calls
- Top Extension by Talk Time — the extension with the highest total talk duration
Charts
- Hourly Distribution — stacked line chart showing inbound, outbound, internal, and abandoned calls by hour of day
- Call Directions — pie chart breaking down inbound vs outbound vs internal
- Daily Trend — line chart of call volume over the selected date range
- Abandon Rate Trend — daily abandon rate as a percentage
- Routing Methods — pie chart showing how calls were routed (direct, ACD queue, auto-attendant, hunt group, etc.)
- Voice Quality (MOS) — bar chart of MOS score distribution
Agent Performance Table
A table at the bottom ranks all extensions by call volume, showing:
- Extension name and number
- Total calls, inbound count, outbound count
- Total talk time and average talk time
- Average MOS score (color-coded: green ≥ 4.0, orange ≥ 3.0, red < 3.0) Clicking an agent row navigates to the Calls page filtered to that extension.
AI Briefing
Click the ✨ AI Briefing button in the top-right corner to generate an executive summary of your dashboard data. The AI analyzes call volumes, answer and abandon rates, timing metrics, quality scores, transfer patterns, and extension performance for the current date range, then produces a structured briefing with an overview, key highlights, concerns, and actionable recommendations.
From the briefing modal you can:
- Email the briefing to a colleague or manager
- Share a one-time link that anyone can view without logging in
- Copy the briefing text to your clipboard
This feature is also available on the Queues and AI Insights