Trunks
The Trunks page monitors SIP trunk registration status across all tenants and PBX servers in your fleet.
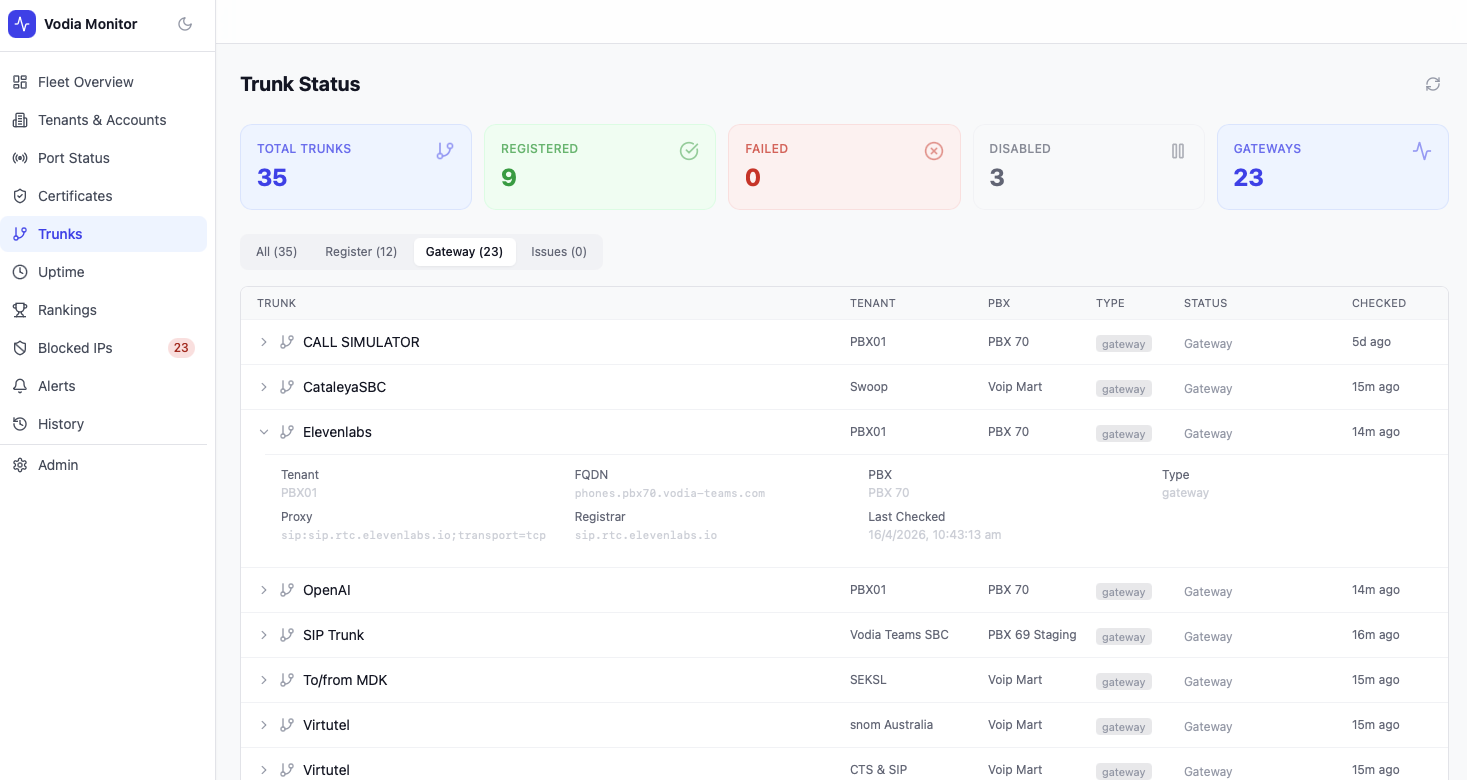
Summary Cards
| Metric | Description |
|---|---|
| Total Trunks | All trunks across all PBX servers |
| Registered | Trunks with a successful registration response (e.g. 200 OK) |
| Failed | Trunks returning error responses |
| Disabled | Trunks that are configured but not active |
| Gateways | Trunks operating in gateway mode (no registration required) |
Trunk Table
Filter trunks by type using the tabs: All, Register, Gateway, Issues.
Each row shows:
| Column | Description |
|---|---|
| Trunk | Trunk name |
| Tenant | The PBX domain this trunk belongs to |
| PBX | The PBX server |
| Type | register or gateway |
| Status | 200 OK, Disabled, Gateway, or error code |
| Checked | Time since last poll |
Trunk Detail
Expanding a trunk row shows full detail:
- Tenant and FQDN
- PBX server
- Type — register or gateway
- Proxy — SIP proxy address
- Registrar — registrar hostname
- Account — SIP account / DID
- Last Checked — exact timestamp
- Status — full status response
- Response time — round-trip in seconds
- Transport detail — resolved IP, port, and protocol
Issues Tab
The Issues tab filters to trunks with non-OK, non-disabled, non-gateway statuses — useful for quickly identifying registration failures without scrolling through the full list.
Alerts
Registration drop alerts fire when a trunk's registered endpoint count falls significantly below its baseline average. These appear in the Alerts page and can trigger notifications via email, SMS, or webhook.