Vodia Analytics
Call analytics and AI insights for Vodia PBX
Vodia Analytics is a self-hosted platform that turns your Vodia PBX call data into actionable dashboards, searchable call records, AI-powered transcriptions, and queue performance metrics — all running on your own infrastructure.
What You Get
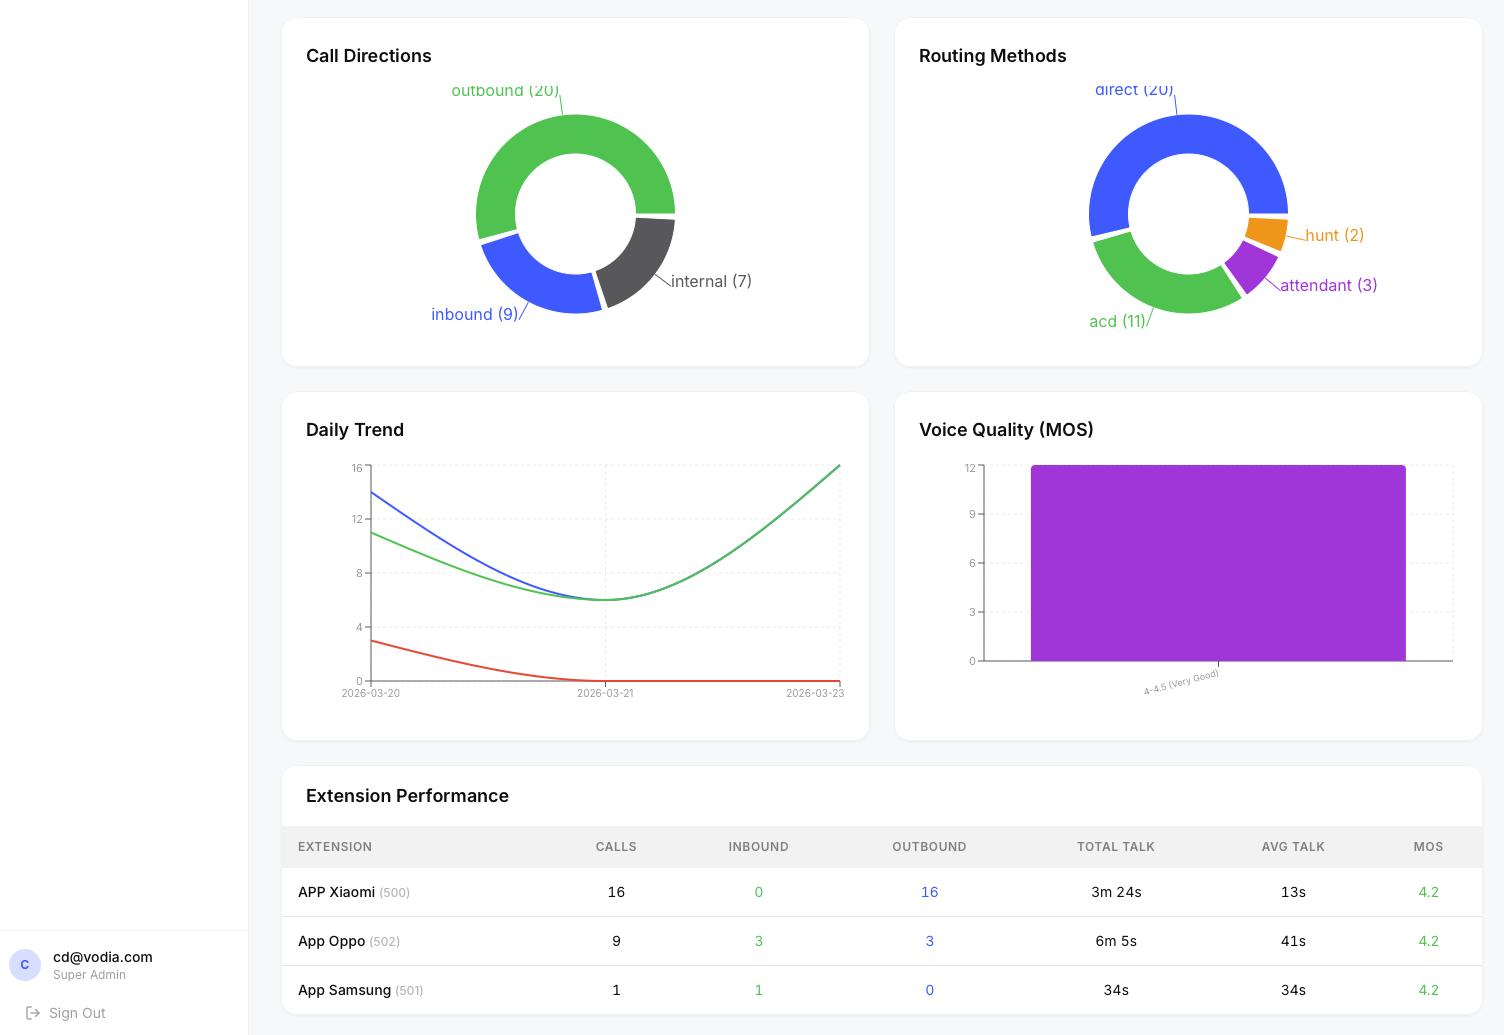
- Dashboard — KPIs, hourly/daily trends, call quality, agent performance at a glance
- Call Search — filters across every CDR field, with one-click playback and debug views
- Queue Analytics — per-queue breakdowns, abandon rates, agent performance within queues
- Extension Performance — call volume, talk time, and MOS quality per extension
- AI Transcription — local Whisper transcription (audio never leaves your server), with stereo caller/agent separation
- AI Analysis — GPT-4o-mini summaries, sentiment, topics, resolution detection, and action items
- Shareable Links — share call details and transcripts with anyone via one-time secure links
- Multi-Tenant — one instance serves multiple PBX systems, fully isolated
- Role-Based Access — super admin, admin, viewer, and queue manager roles
- Live Queue and Call Monitoring - Live page provides real-time visibility into active calls and queue operations across your connected PBX systems. Data streams directly from the PBX via WebSocket — no polling, no delay.
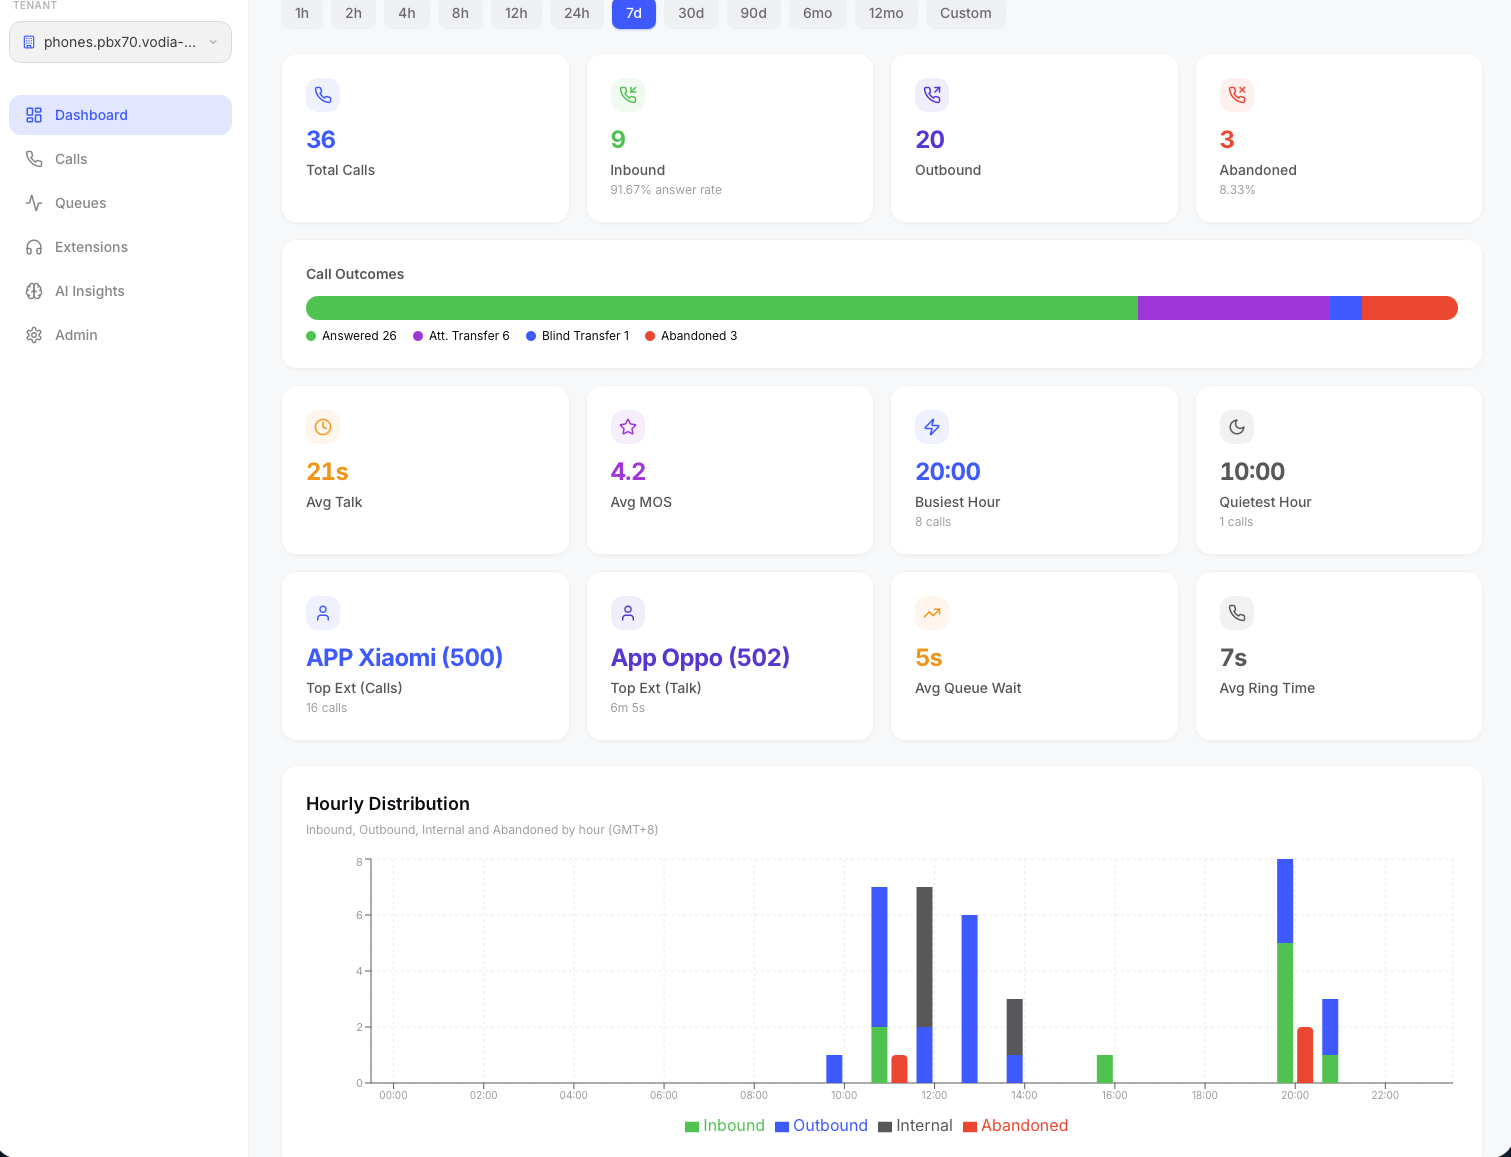
The main dashboard showing call KPIs, hourly distribution, and agent performance.
Quick Start
On a fresh Ubuntu 24.04 server with a domain pointed to it:
apt-get install -y wget unzip
wget https://cdn.vodia.net/cdrstats/cdrstats.zip
unzip cdrstats.zip
cd cdrstats
bash install.sh
The installer asks five questions — domain, admin email, admin password, OpenAI key (optional), and PBX IP whitelist (optional) — then handles everything else automatically. You'll be up and running in under 5 - 10 minutes.
Vodia Analytics requires a Vodia PBX (v69+) configured to send webcdrs. See Connecting Your PBX for setup instructions.