Port Status
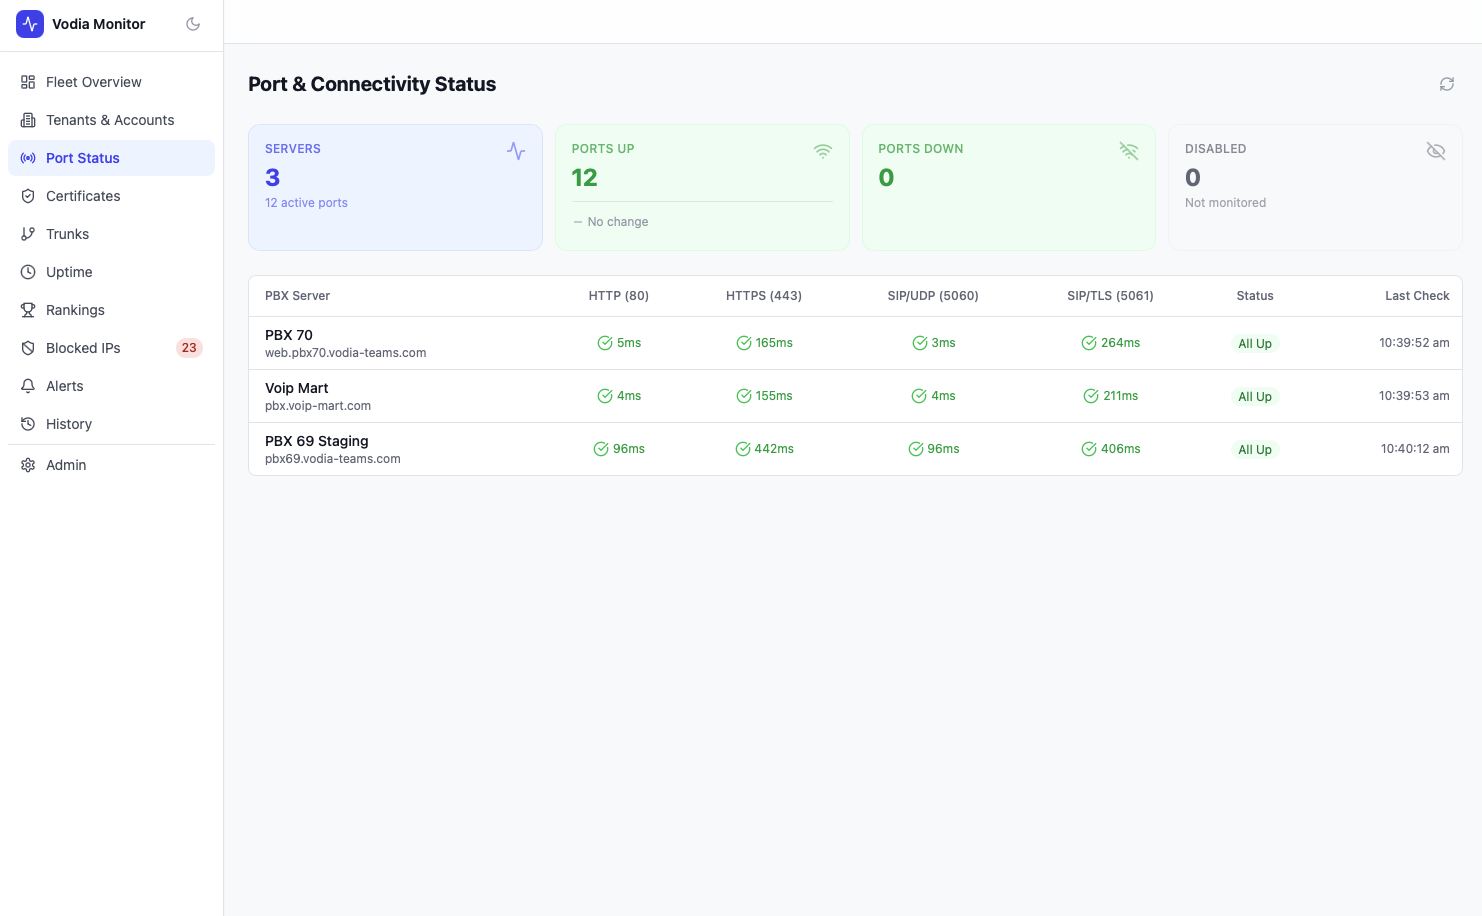
The Port Status page monitors the four critical ports on every PBX server in your fleet: HTTP (80), HTTPS (443), SIP-UDP (5060), and SIP-TLS (5061).
Summary Cards
| Metric | Description |
|---|---|
| Servers | Total servers monitored, with active port count |
| Ports Up | Total ports currently responding, with trend vs previous period |
| Ports Down | Total ports currently unreachable |
| Disabled | Ports excluded from monitoring |
Port Table
Each server gets a row showing:
- PBX Server — hostname with FQDN
- HTTP (80) — response time in ms, or error indicator
- HTTPS (443) — response time in ms, or error indicator
- SIP/UDP (5060) — response time in ms, or error indicator
- SIP/TLS (5061) — response time in ms, or error indicator
- Status — overall status for that server (All Up / Degraded / Down)
- Last Check — timestamp of the most recent poll
Response times are colour-coded — fast responses appear green, slower responses amber, and unreachable ports red.
Poll Frequency
Port checks run on the interval configured per PBX (default 30s–2 min). The last check timestamp confirms recency. For historical uptime data and downtime events, see the Uptime page.