Live
The Live page provides real-time visibility into active calls and queue operations across your connected PBX systems. Data streams directly from the PBX via WebSocket — no polling, no delay.
Prerequisites
Live features require a PBX WebSocket connection to be configured. In the Admin panel under IP Whitelist, expand any whitelisted PBX entry and enable Live Connection by providing:
Create a dedicated administrator account on your Vodia PBX for use with Vodia Analytics. To restrict access, whitelist the Vodia Analytics server's IP address on your PBX so that only this IP can authenticate using the dedicated admin credentials.
- PBX Hostname — the PBX server address (e.g.
pbx.example.com) - PBX Port — typically
443 - Admin User — PBX admin username for API authentication
- Admin Password — PBX admin password (encrypted at rest with AES-256-GCM)
Use the Test Connection button to verify credentials before saving. Once configured, the Live page automatically connects when any user navigates to it.
A connection status indicator in the top-right corner shows the current state: Connected (green), Connecting (orange), or Disconnected (red). The connection automatically reconnects if interrupted.
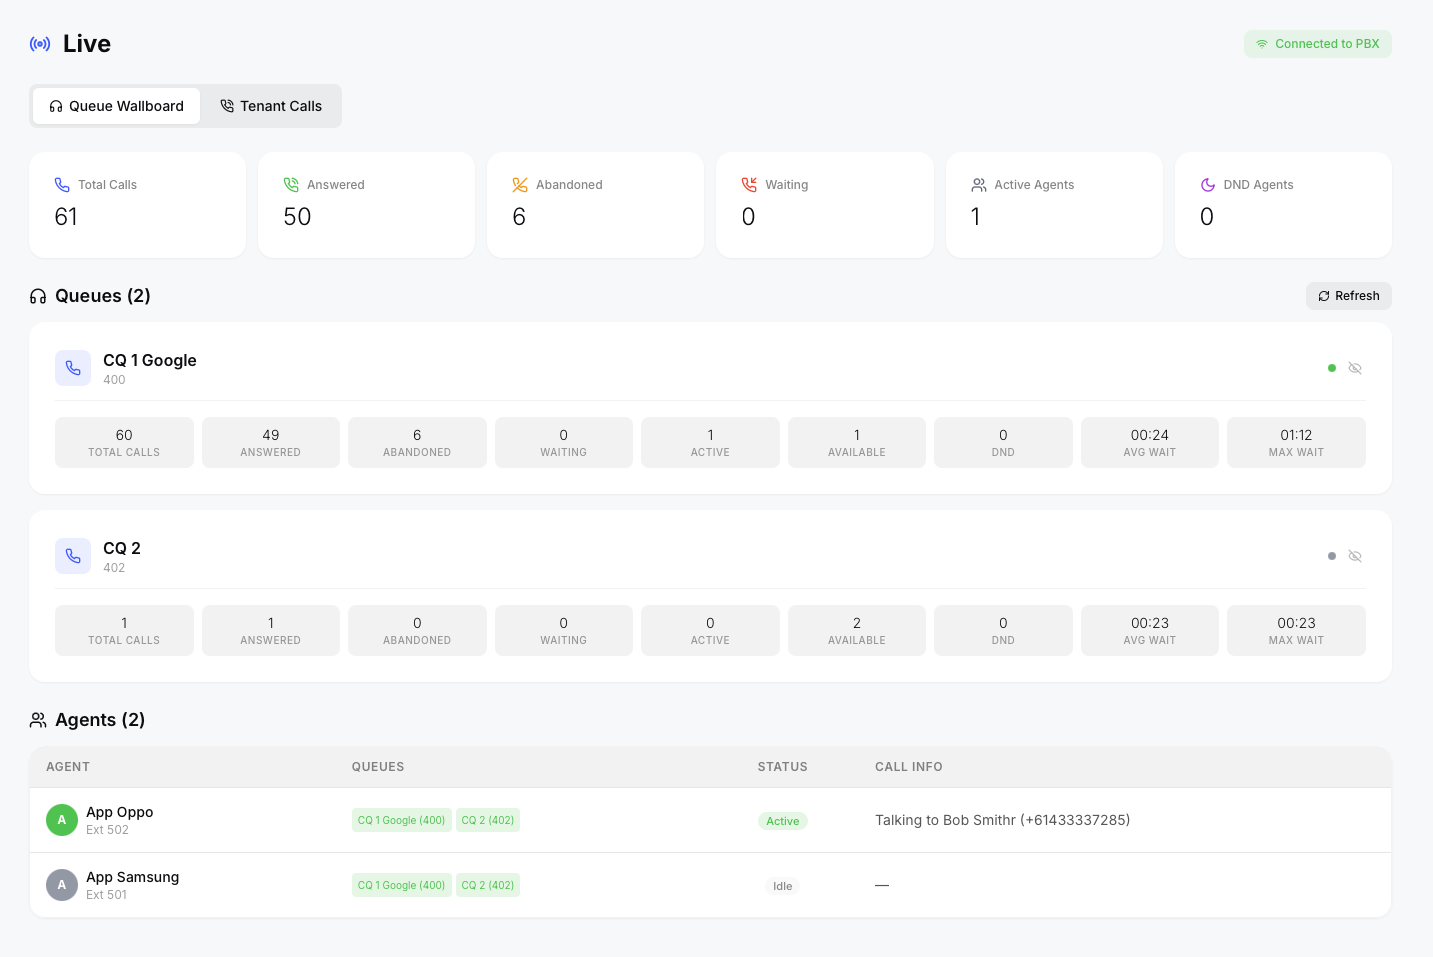
Queue Wallboard
The default tab. Provides a real-time operations dashboard for queue supervisors.
Summary Cards
Six top-level metrics updated in real-time:
- Total Calls — all calls that have entered queues during the current session
- Answered — calls answered by agents
- Abandoned — calls that left the queue before being answered
- Waiting — callers currently waiting in queue (highlights orange above 2, red above 5)
- Active Agents — agents currently on calls
- DND Agents — agents in Do Not Disturb mode
Queue Cards
Each queue is displayed as a card with live metrics:
- Waiting — callers currently in queue (badge pulses red when critical)
- Active — agents currently handling calls
- Available — agents idle and ready for calls
- DND — agents in Do Not Disturb
- Total Calls / Answered / Abandoned — session counters
- Avg Wait / Max Wait — queue wait time statistics
Queue cards are automatically sorted by activity — queues with waiting callers appear first, followed by queues with active calls, then alphabetically.
Cards with elevated wait counts show colored borders: orange for moderate load, red with pulse animation for critical load.
Hiding Queues
For environments with many queues, click the eye icon on any queue card to hide it. Hidden queues appear as compact chips in a "Hidden Queues" section at the bottom — click any chip to restore it. Summary totals only reflect visible queues.
Refresh Button
Click Refresh to force an immediate queue re-discovery from the PBX. This picks up agent login/logout changes, new queues, and updated agent assignments without waiting for the automatic 5-minute refresh cycle.
Agent Status Grid
A table showing every agent across all queues:
| Column | Description |
|---|---|
| Agent | Name and extension number |
| Queues | Queue memberships with login status (green = logged in, grey = logged out) |
| Status | Current state: Active (green), Ringing (orange, pulsing), DND (red), or Idle |
| Call Info | For active agents: "Talking to [name] ([number])". For ringing: "Ringing from [name]" |
Agents are sorted by activity — talking agents first, then ringing, then idle, with DND agents at the bottom.
Call information is resolved from multiple sources: BLF (busy lamp field) events provide real-time state, and call-state data enriches caller details for direct calls that bypass the queue.
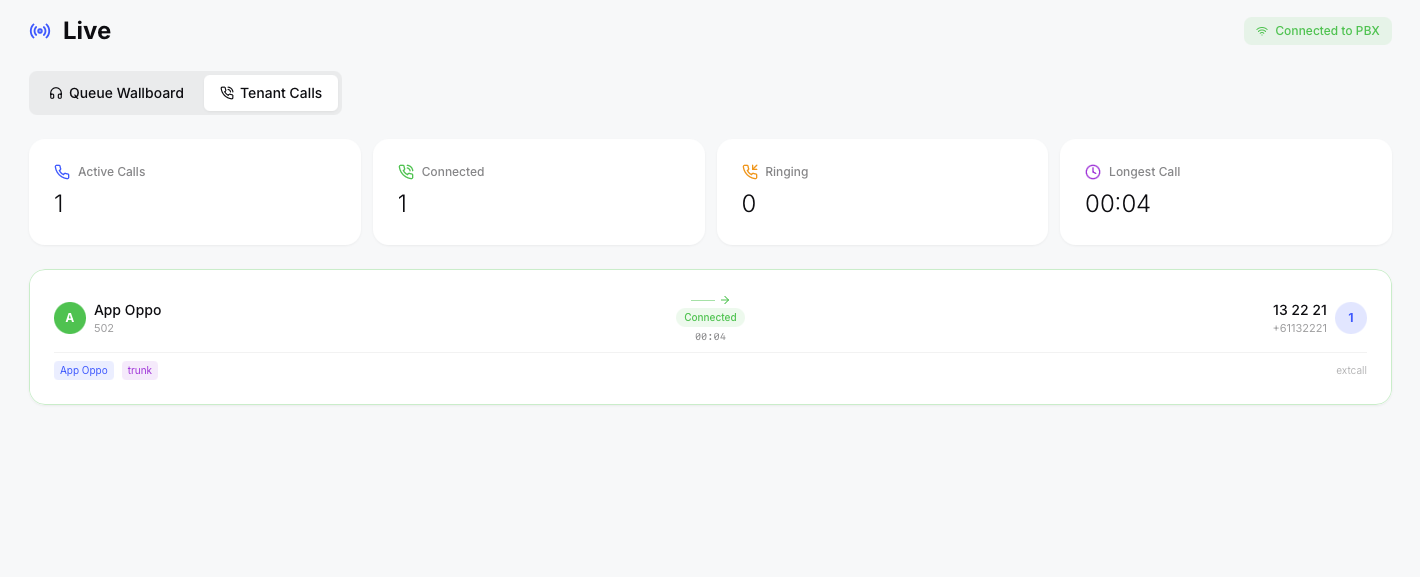
Tenant Calls
The second tab shows all active calls across the tenant in a visual card layout.
Summary Strip
Four live-updating metric cards:
- Active Calls — total calls in progress
- Connected — calls where parties are talking
- Ringing — calls currently ringing (highlights when above 3)
- Longest Call — duration of the longest active call, ticking live
Call Cards
Each active call is displayed as a card showing:
- Caller — name and number on the left with an avatar badge
- Flow indicator — animated arrow between caller and destination, with state badge (Connected/Ringing) and live duration
- Destination — name and number on the right with an avatar badge
The bottom bar of each card shows:
- Agent names — resolved from BLF data (blue badges)
- Trunk — if the call traverses a trunk (purple badge)
- Queue — if the call entered a queue, showing the queue display name (orange badge)
- Call type — the SIP call type
Cards are sorted by state: ringing calls appear first with a pulsing orange border, connected calls next with a green border, then any other states.
Call states are cross-referenced between call-state and BLF data for accuracy — a queue call showing "alerting" in the PBX call-state but "confirmed" in the agent's BLF is correctly displayed as "Connected".