Overview
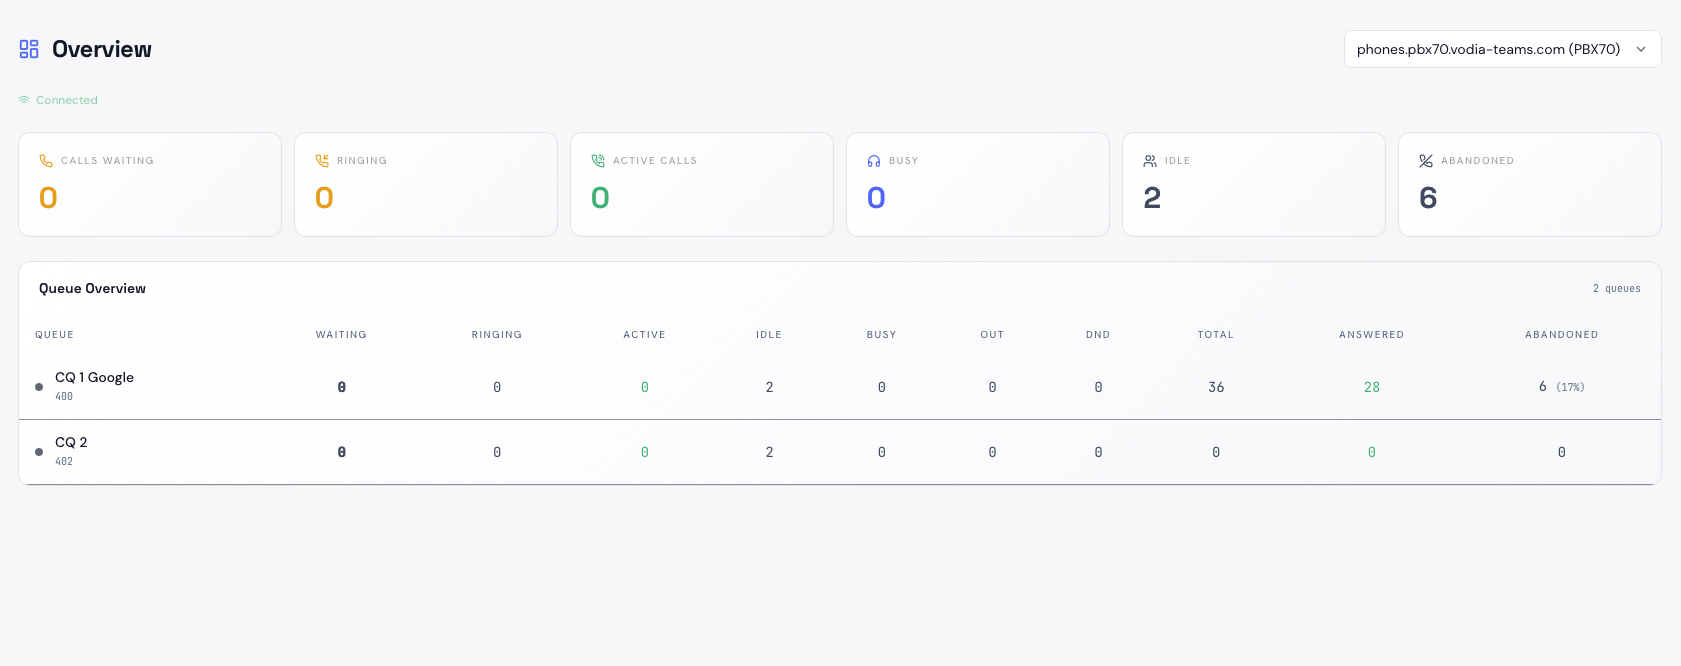
The Overview page is the home screen of Vodia Wallboards. It provides a live summary of all queues on the selected tenant, with key metrics displayed in large cards and a detailed queue table below.
Tenant Selector
If you have multiple tenants enabled across your PBX connections, a dropdown at the top right lets you switch between them. Your last selected tenant is remembered across sessions.
Summary Metrics
Six metric cards at the top of the page show fleet-wide totals for the selected tenant:
| Metric | Description |
|---|---|
| Calls Waiting | Calls currently queued and waiting for an agent. Turns orange above 5, red above 10 |
| Ringing | Agents currently being rung by an inbound queue call |
| Active Calls | Calls currently connected to an agent |
| Busy | Agents on non-queue calls (internal, outbound, or hunt group) |
| Idle | Agents logged in and available. Shows logged-out count as a subtitle |
| Abandoned | Total abandoned calls. Shows abandon rate percentage; turns red above 25% |
Queue Overview Table
The queue table lists every discovered queue on the selected tenant, sorted by calls waiting (highest first). Each row shows:
| Column | Description |
|---|---|
| Queue | Queue display name and internal name |
| Waiting | Calls in queue right now |
| Ringing | Agents currently being rung |
| Active | Agents connected on ACD calls |
| Idle | Agents available and not on a call |
| Busy | Agents on non-queue calls |
| Out | Agents logged out of this queue |
| DND | Agents with Do Not Disturb active |
| Total | Total calls handled today |
| Answered | Calls answered by an agent |
| Abandoned | Calls abandoned, with abandon rate percentage |
A coloured dot on each queue row indicates its current state: green for active, orange for moderate queue depth, red for high queue depth, and grey for idle.
Connection Status
A small indicator in the top left shows the WebSocket connection state: Connected, Connecting, or Disconnected. All metrics are live and update in real time when connected.