Wallboards
The Wallboard page is the builder where you create, configure, and manage your wallboards. Each wallboard is a named canvas of widgets arranged in a drag-and-drop grid, scoped to a specific tenant.
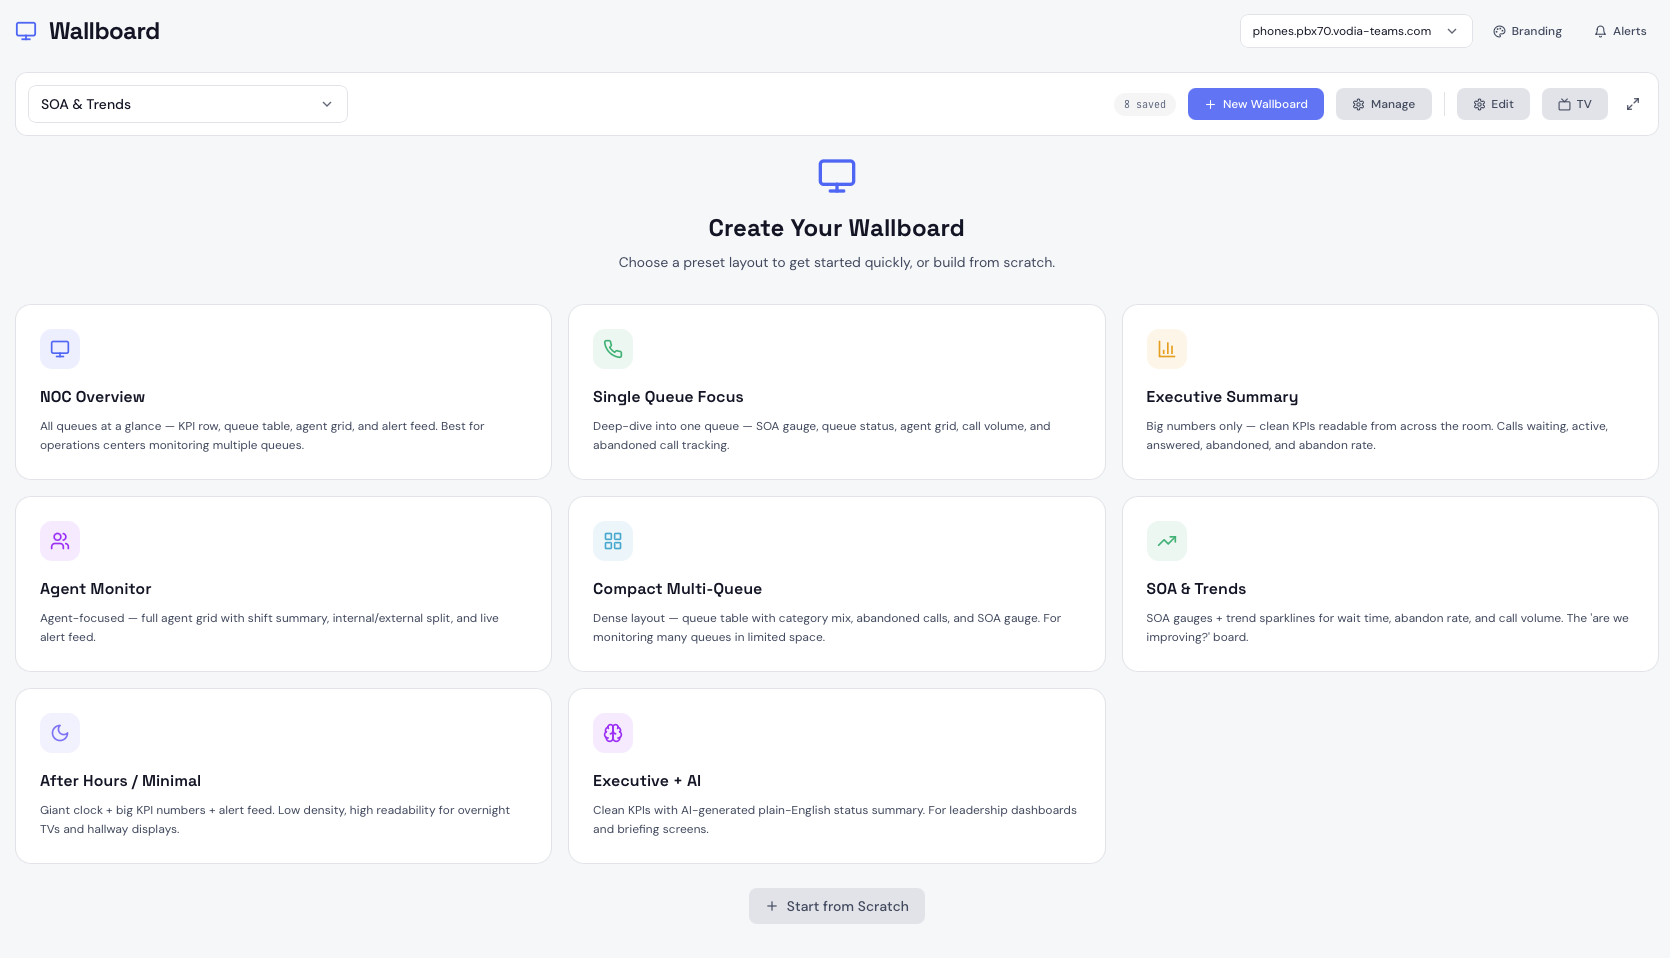
Creating a Wallboard
Click New Wallboard to open the preset selector. You can start from one of the 8 built-in preset layouts or start from scratch with a blank canvas.
Preset Layouts
| Preset | Best For |
|---|---|
| NOC Overview | Operations centers monitoring multiple queues — KPI row, queue table, agent grid, and alert feed |
| Single Queue Focus | Deep-dive into one queue �— SOA gauge, agent grid, call volume, trend charts, and active call list |
| Executive Summary | Leadership screens — large KPI numbers readable from across the room |
| Agent Monitor | Supervisor screens — full agent grid with shift summary and internal/external breakdown |
| Compact Multi-Queue | Dense layouts for many queues in limited space — queue table, category mix, and SOA gauge |
| SOA & Trends | Performance tracking — SOA gauges and trend sparklines for wait time, abandon rate, and volume |
| After Hours / Minimal | Overnight TVs and hallway displays — large clock, key KPIs, and alert feed |
| Executive + AI | Leadership dashboards — clean KPIs with an AI-generated plain-English status summary |
When you select a preset, Vodia Wallboards generates a default widget layout. You can then rearrange, resize, add, and remove widgets freely.
The Builder Canvas
The builder canvas is a 12-column grid. Widgets snap to the grid and can be resized by dragging their bottom-right corner. To move a widget, drag it by its header area.
Adding Widgets
Click the + button or use the widget panel to add a new widget to the canvas. Select the widget type and it will be placed on the canvas ready to configure.
Configuring Widgets
Click the settings icon on any widget to open its configuration panel. Most widgets let you set:
- Queue Scope — which queue(s) the widget pulls data from (see below)
- Metric — for KPI and Trend widgets, which metric to display
- Thresholds — warning and critical values that change the widget's border colour
Queue Scope
Every widget that shows queue data has a queue scope setting:
- Follow wallboard filter — the widget respects the queue filter bar at the top of the wallboard. When you switch queues using the filter bar, all widgets set to "inherit" update together.
- All Queues — always aggregates data from all discovered queues, ignoring the filter bar.
- Specific Queue — always shows data for one named queue, ignoring the filter bar.
Queue Filter Bar
When a wallboard has more than one queue available, a filter bar appears at the top of the canvas. Click any queue name to scope all "inherit" widgets to that queue. Click All Queues to return to the aggregate view. Each queue button shows a badge with the current calls-waiting count.
Managing Wallboards
Click the wallboard name in the builder header to open the wallboard list. From here you can:
- Switch between saved wallboards
- Create a new wallboard with a custom name
- Rename an existing wallboard
- Delete a wallboard
Wallboards are saved automatically as you make changes.
TV Mode
Click the TV button on any wallboard to publish it and get a shareable display link. See Display Mode for full details.